
LAND DEMOGRAPHICS
LAND DEMOGRAPHICS
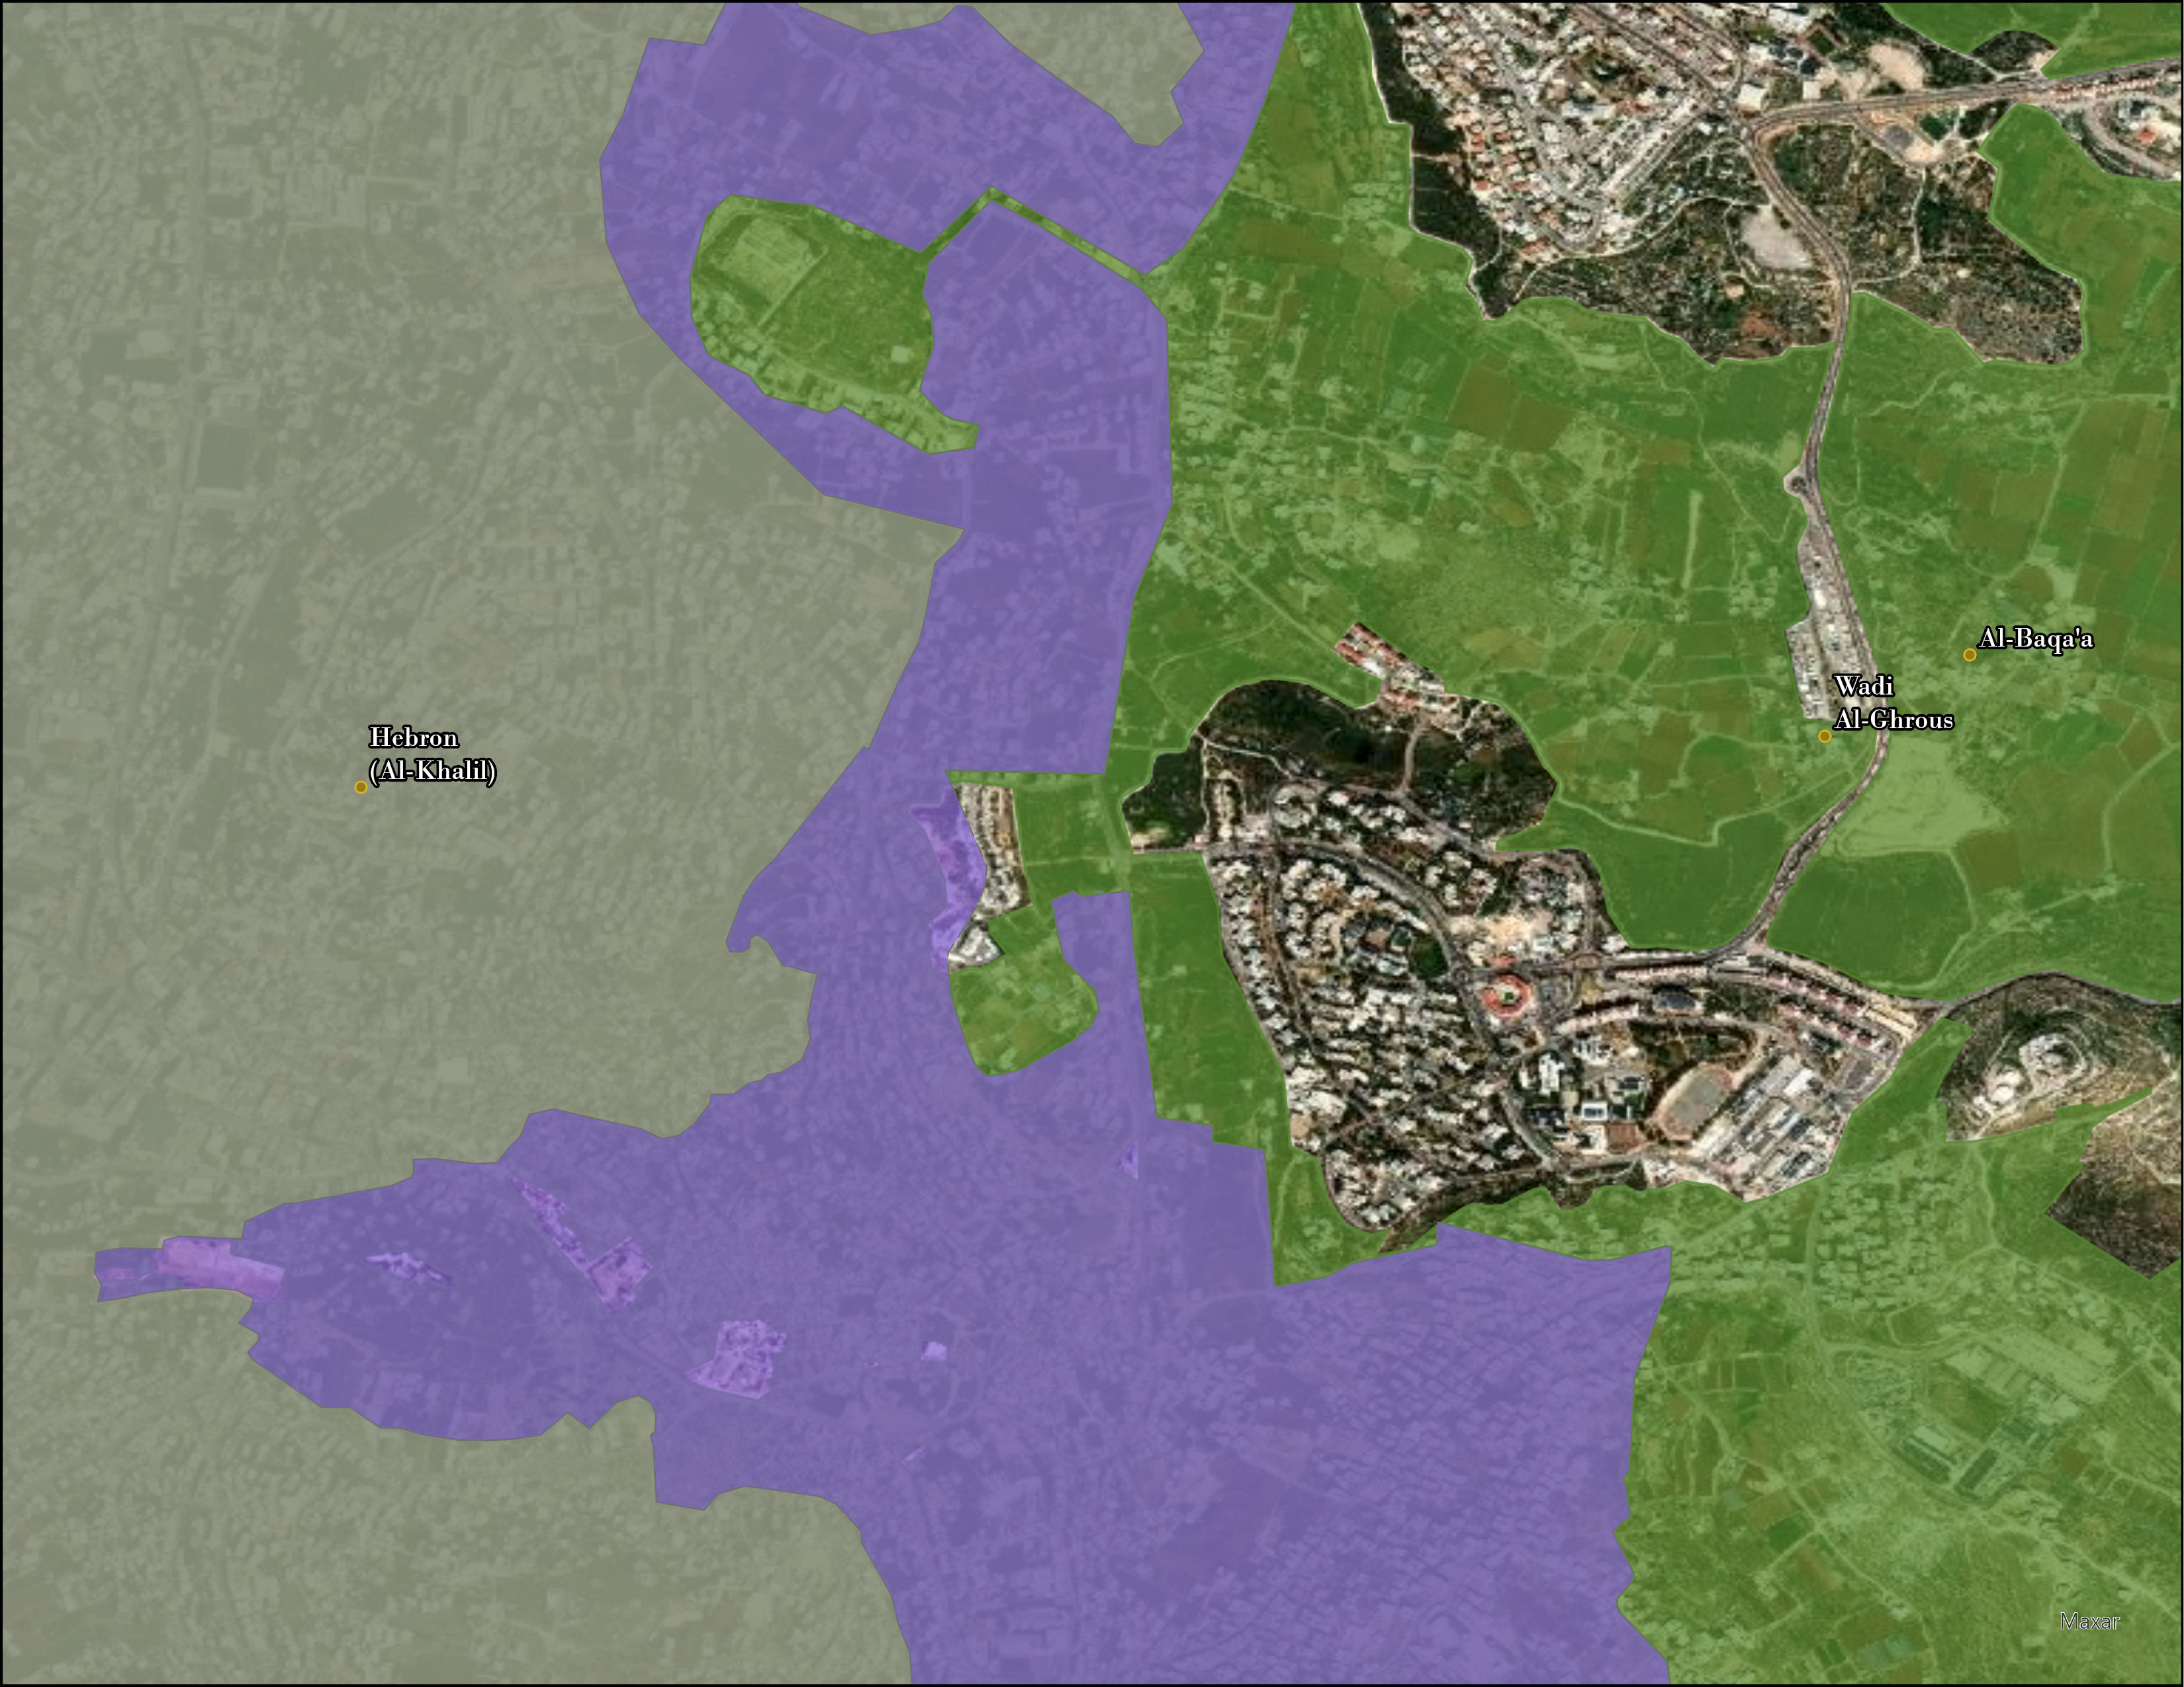
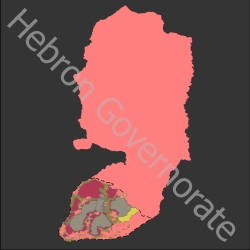
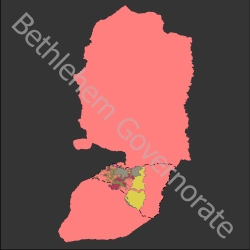
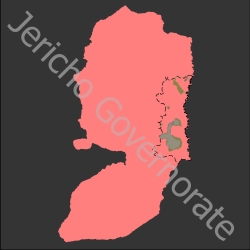
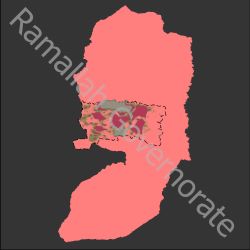
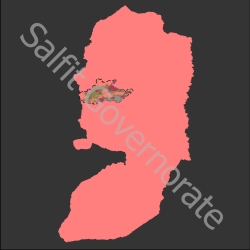
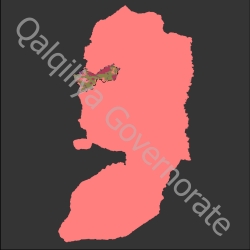
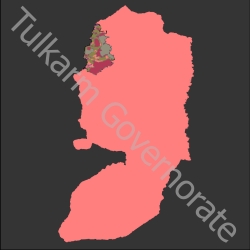
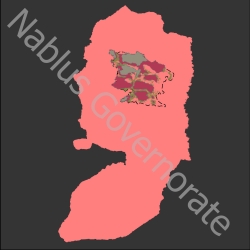
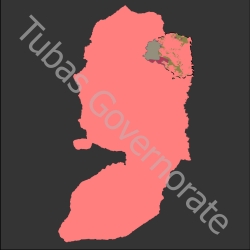
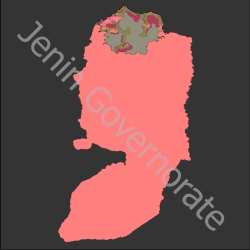
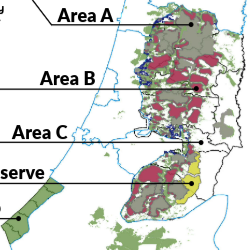
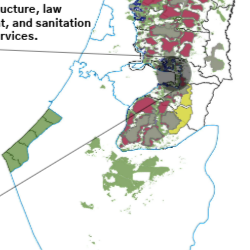
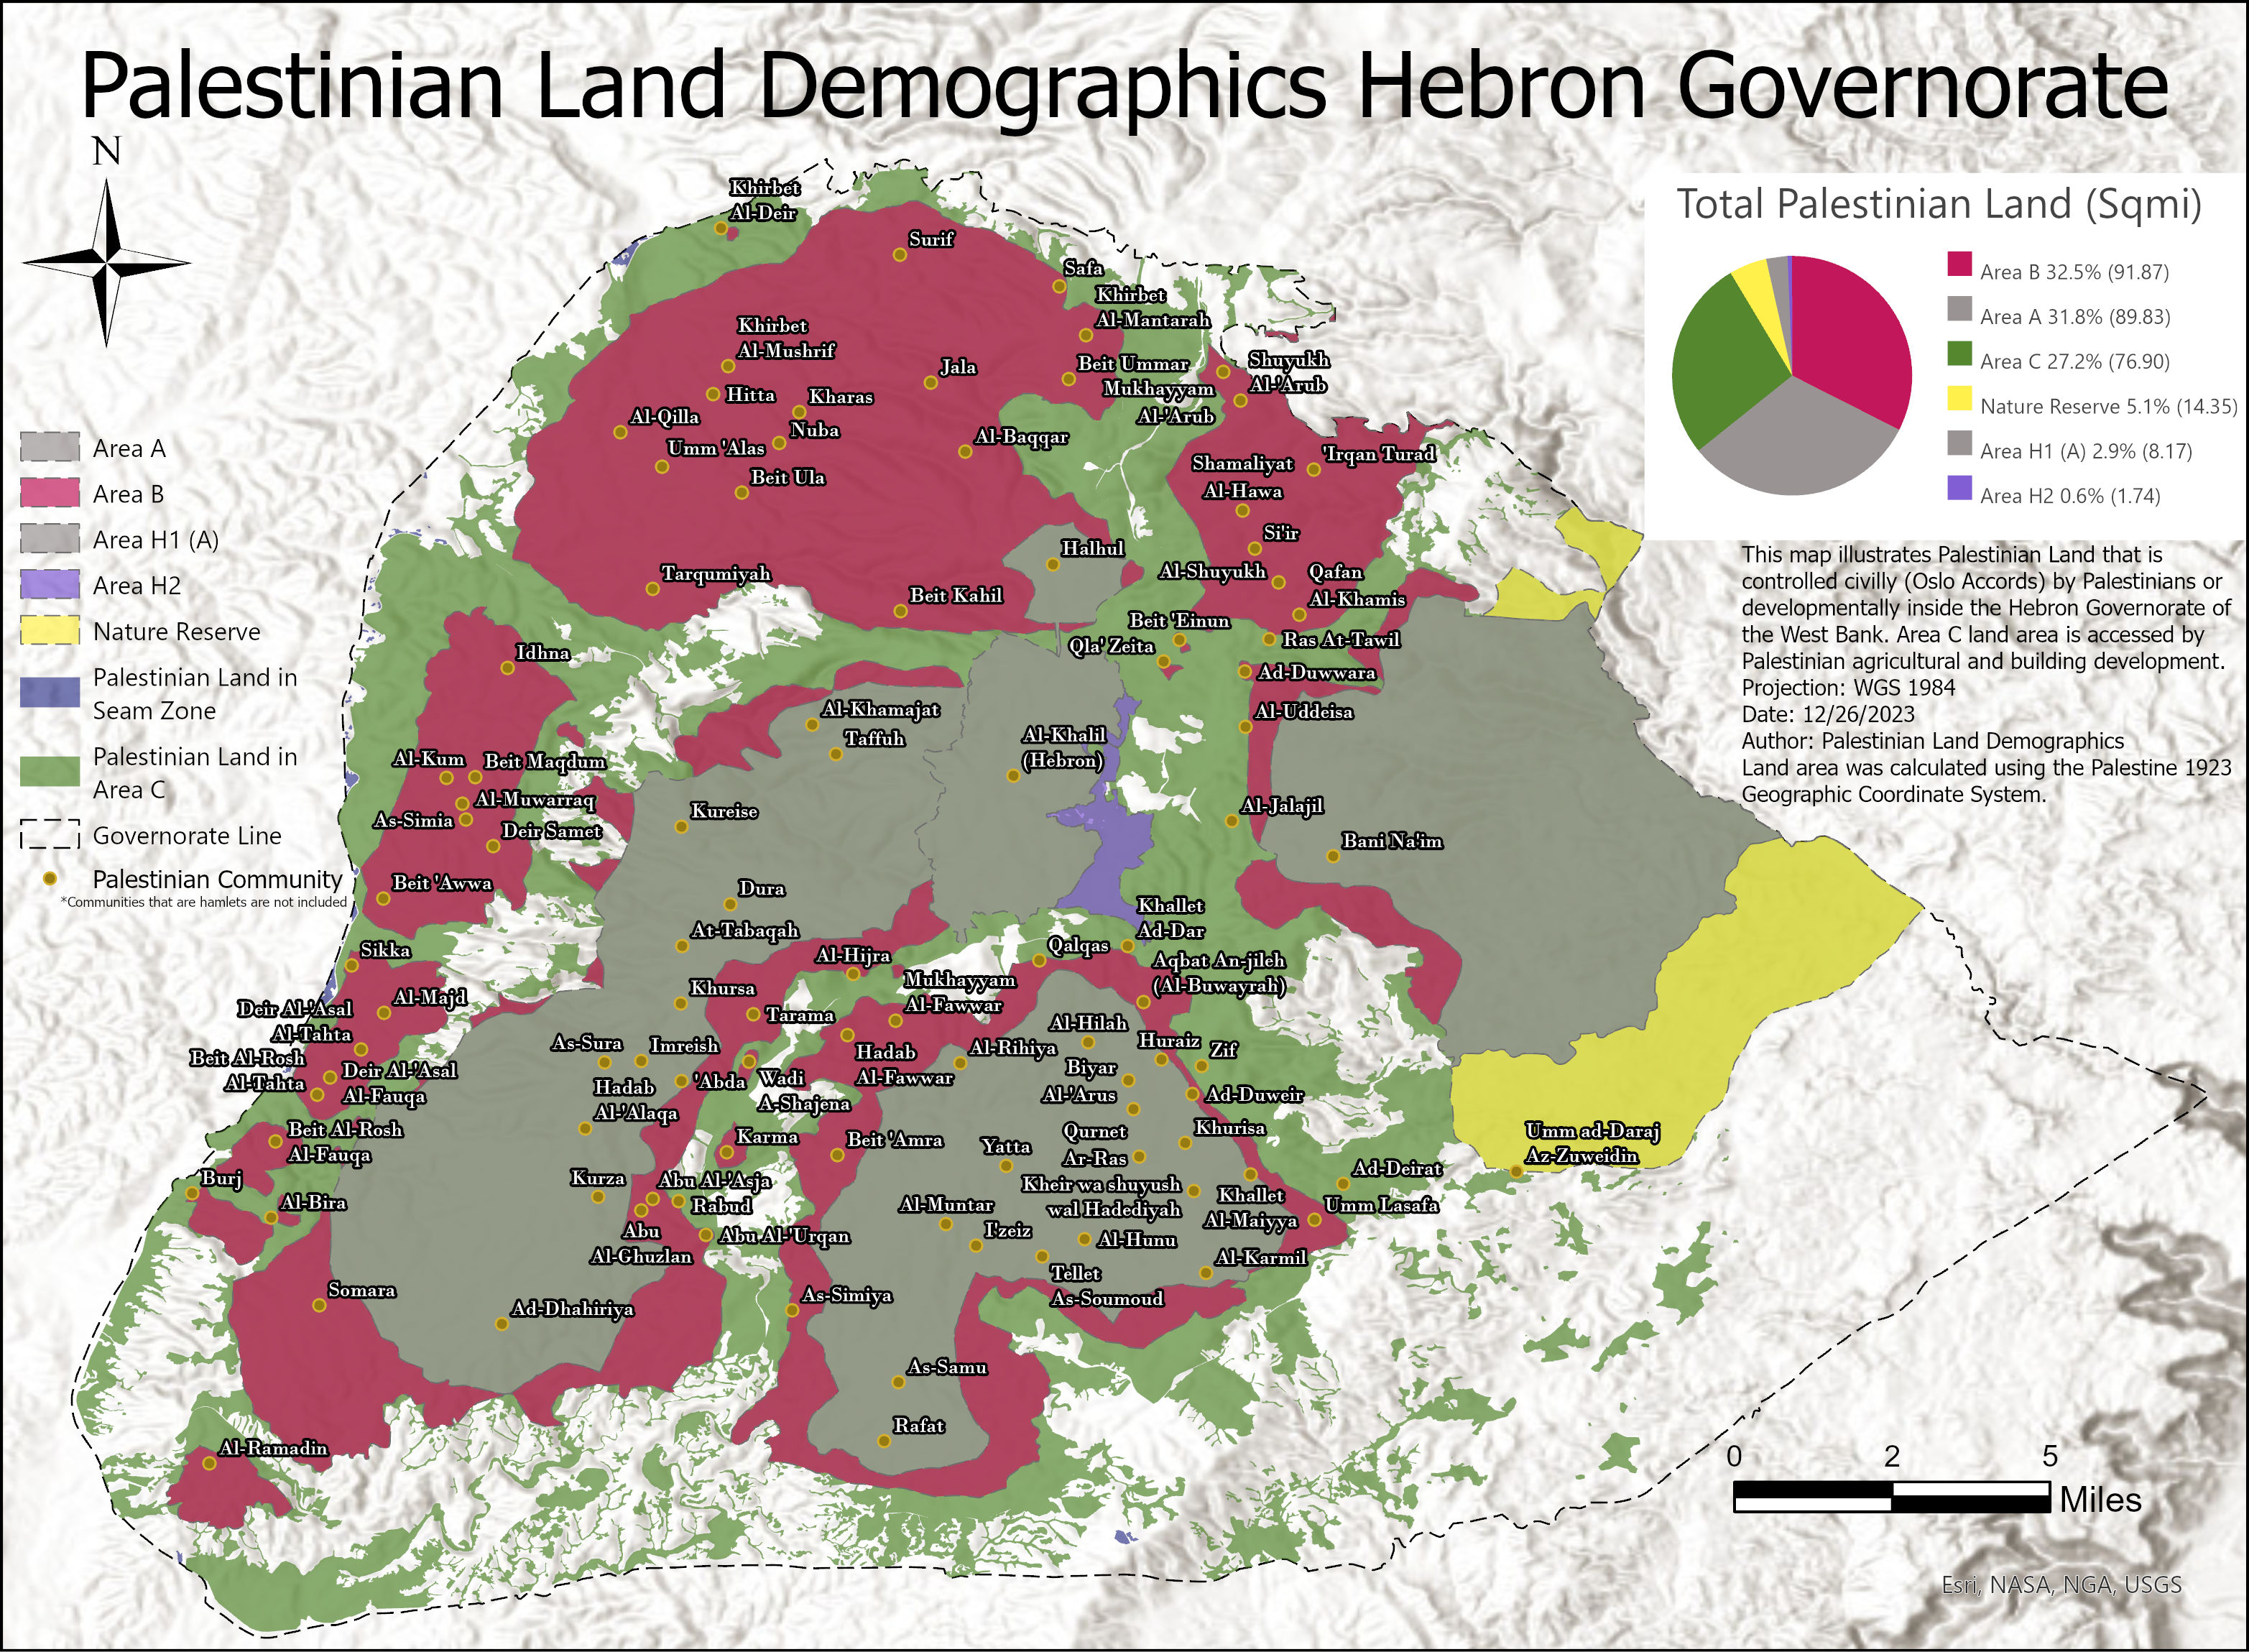
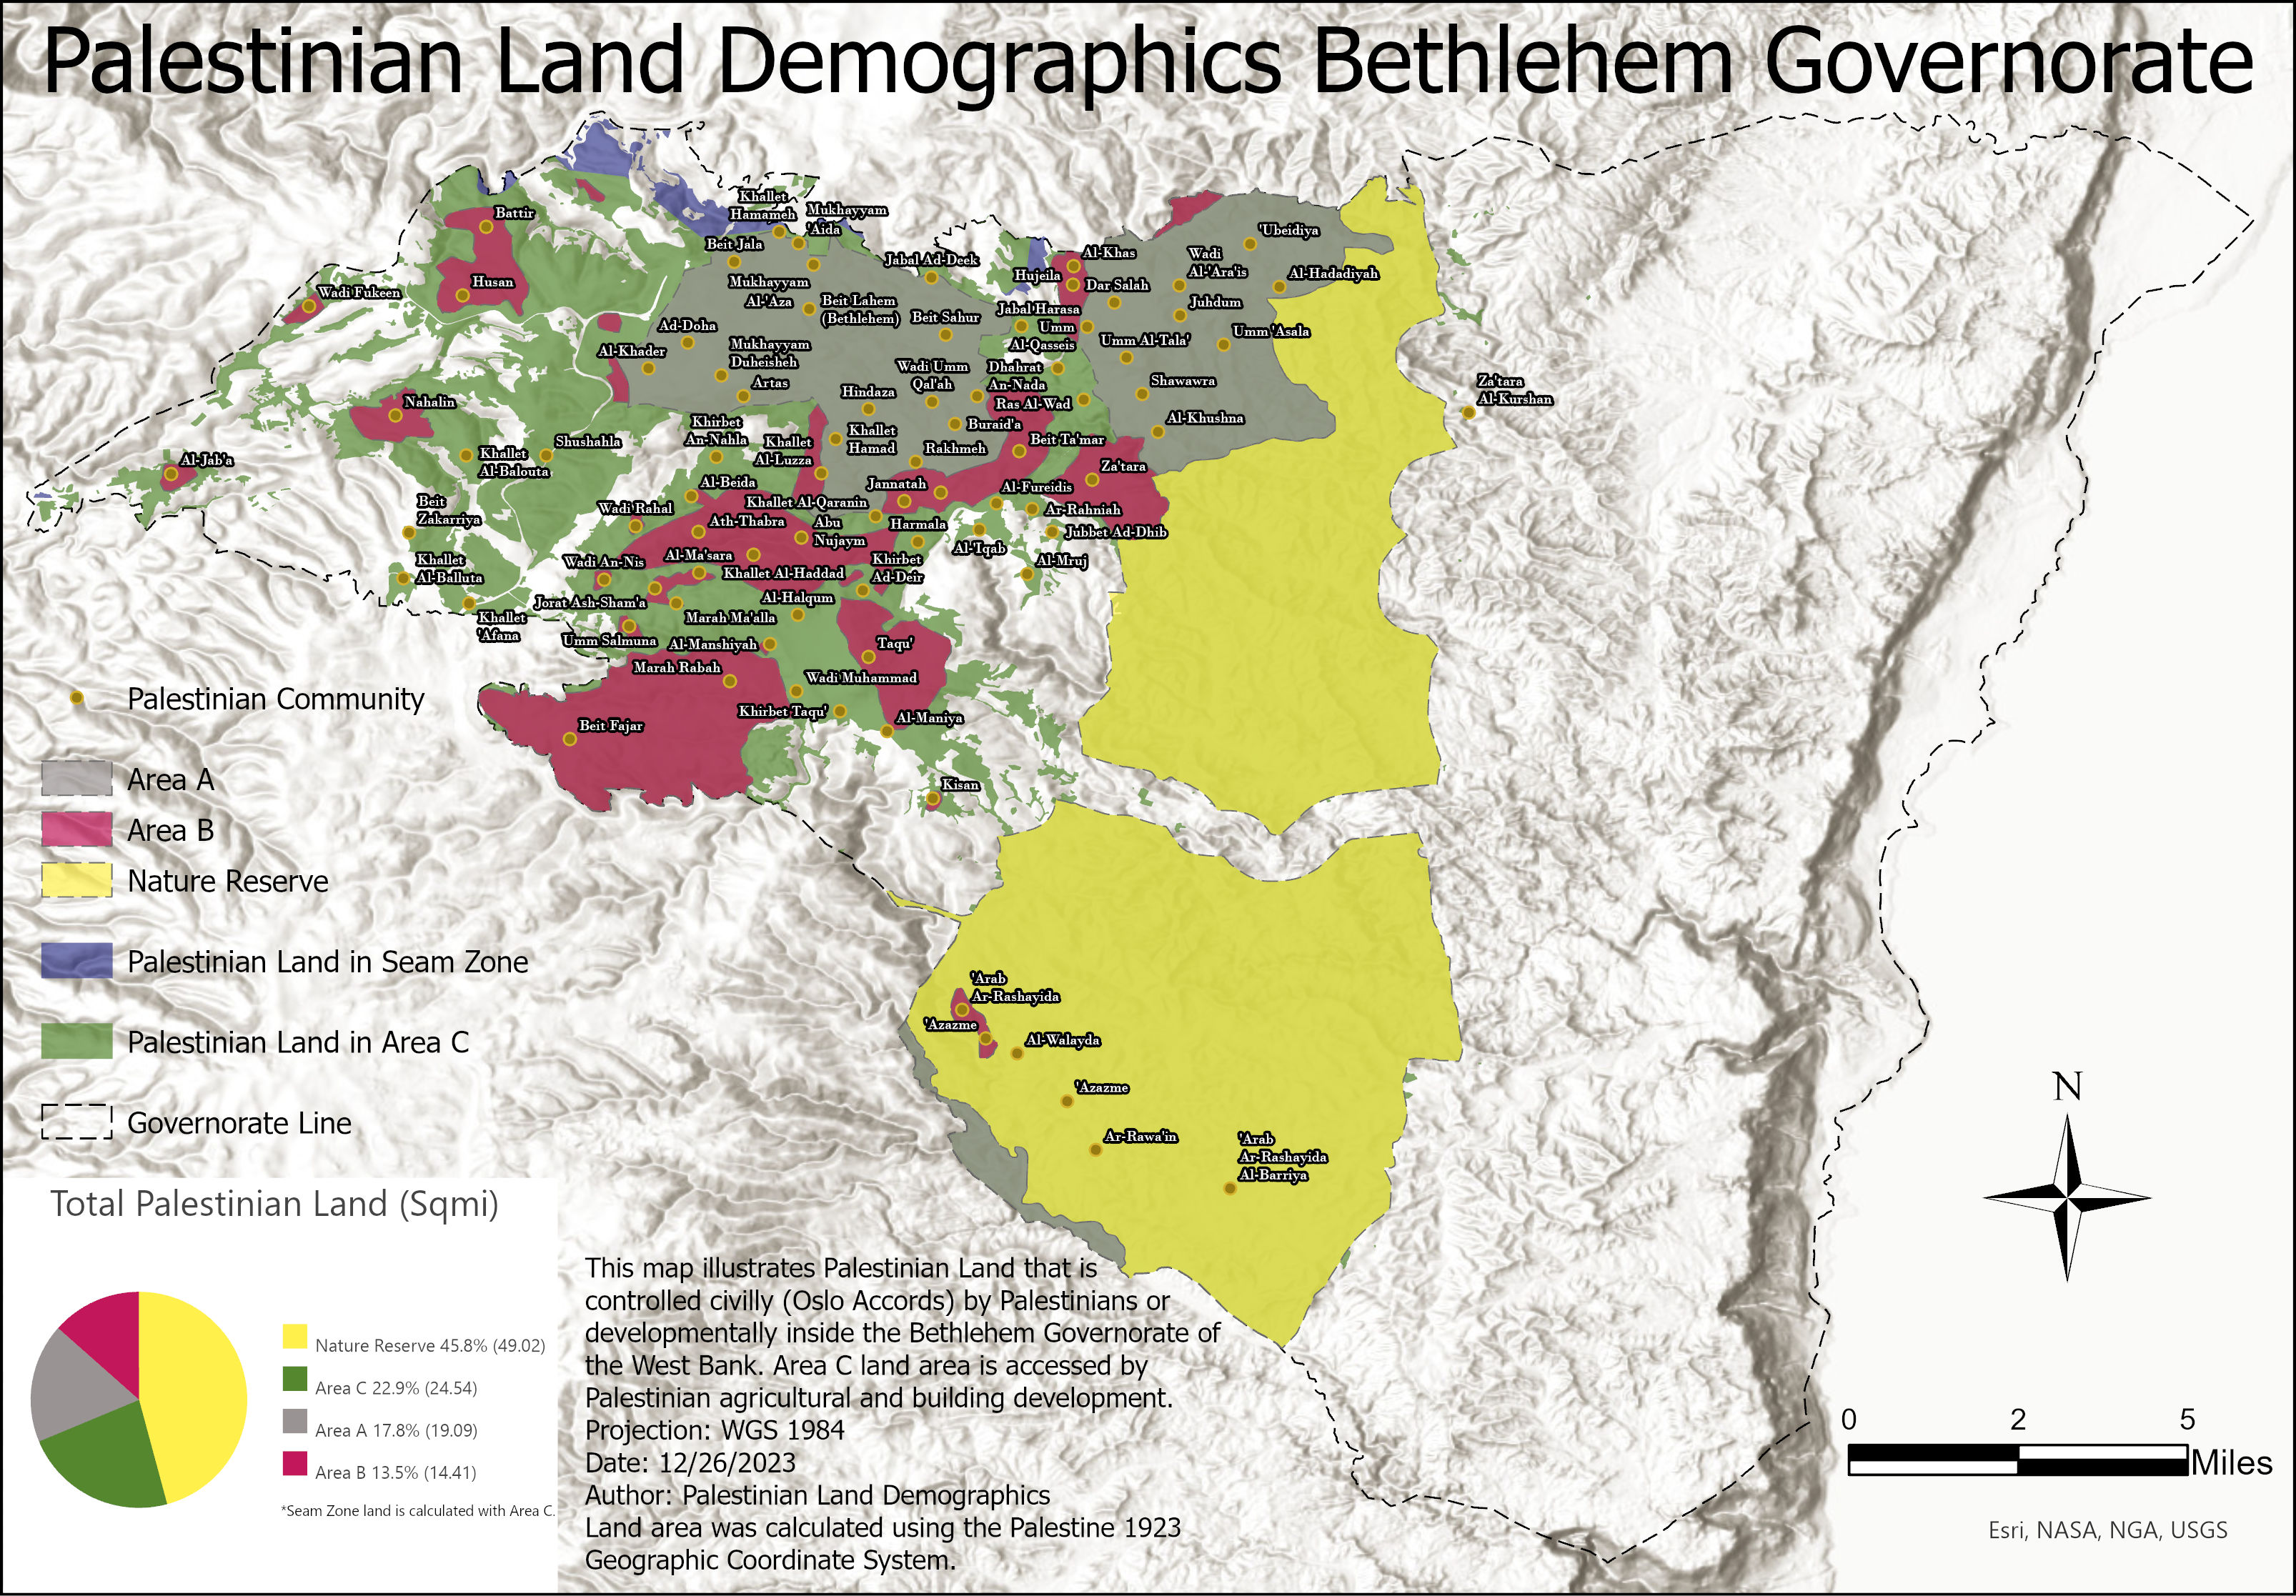
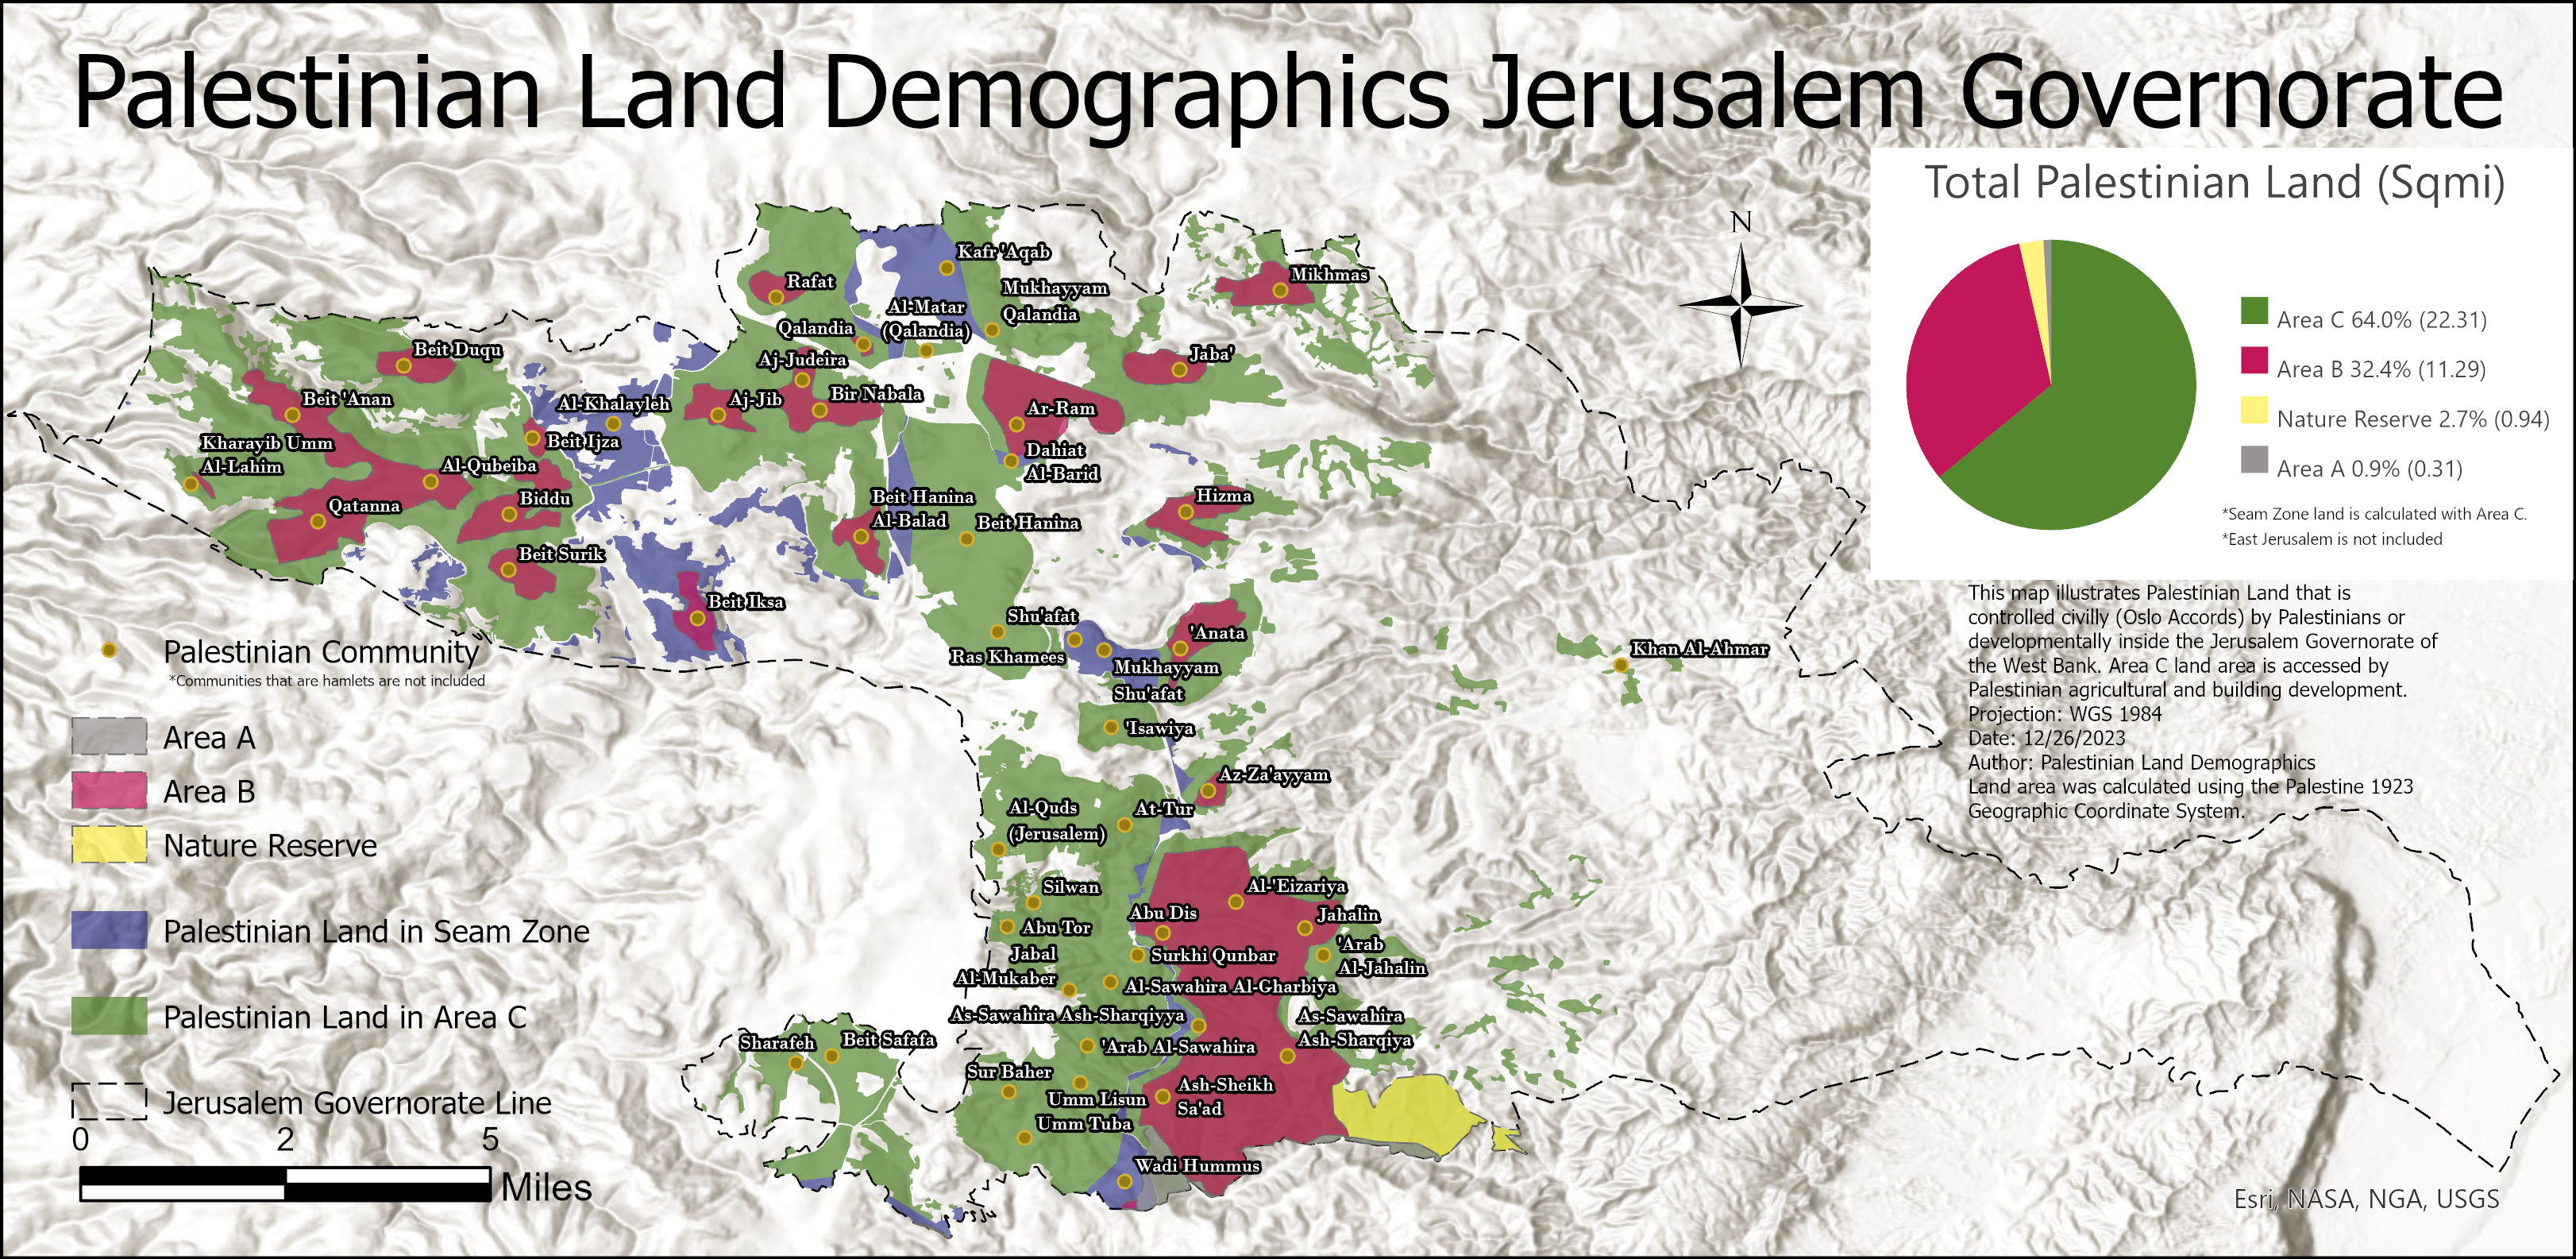
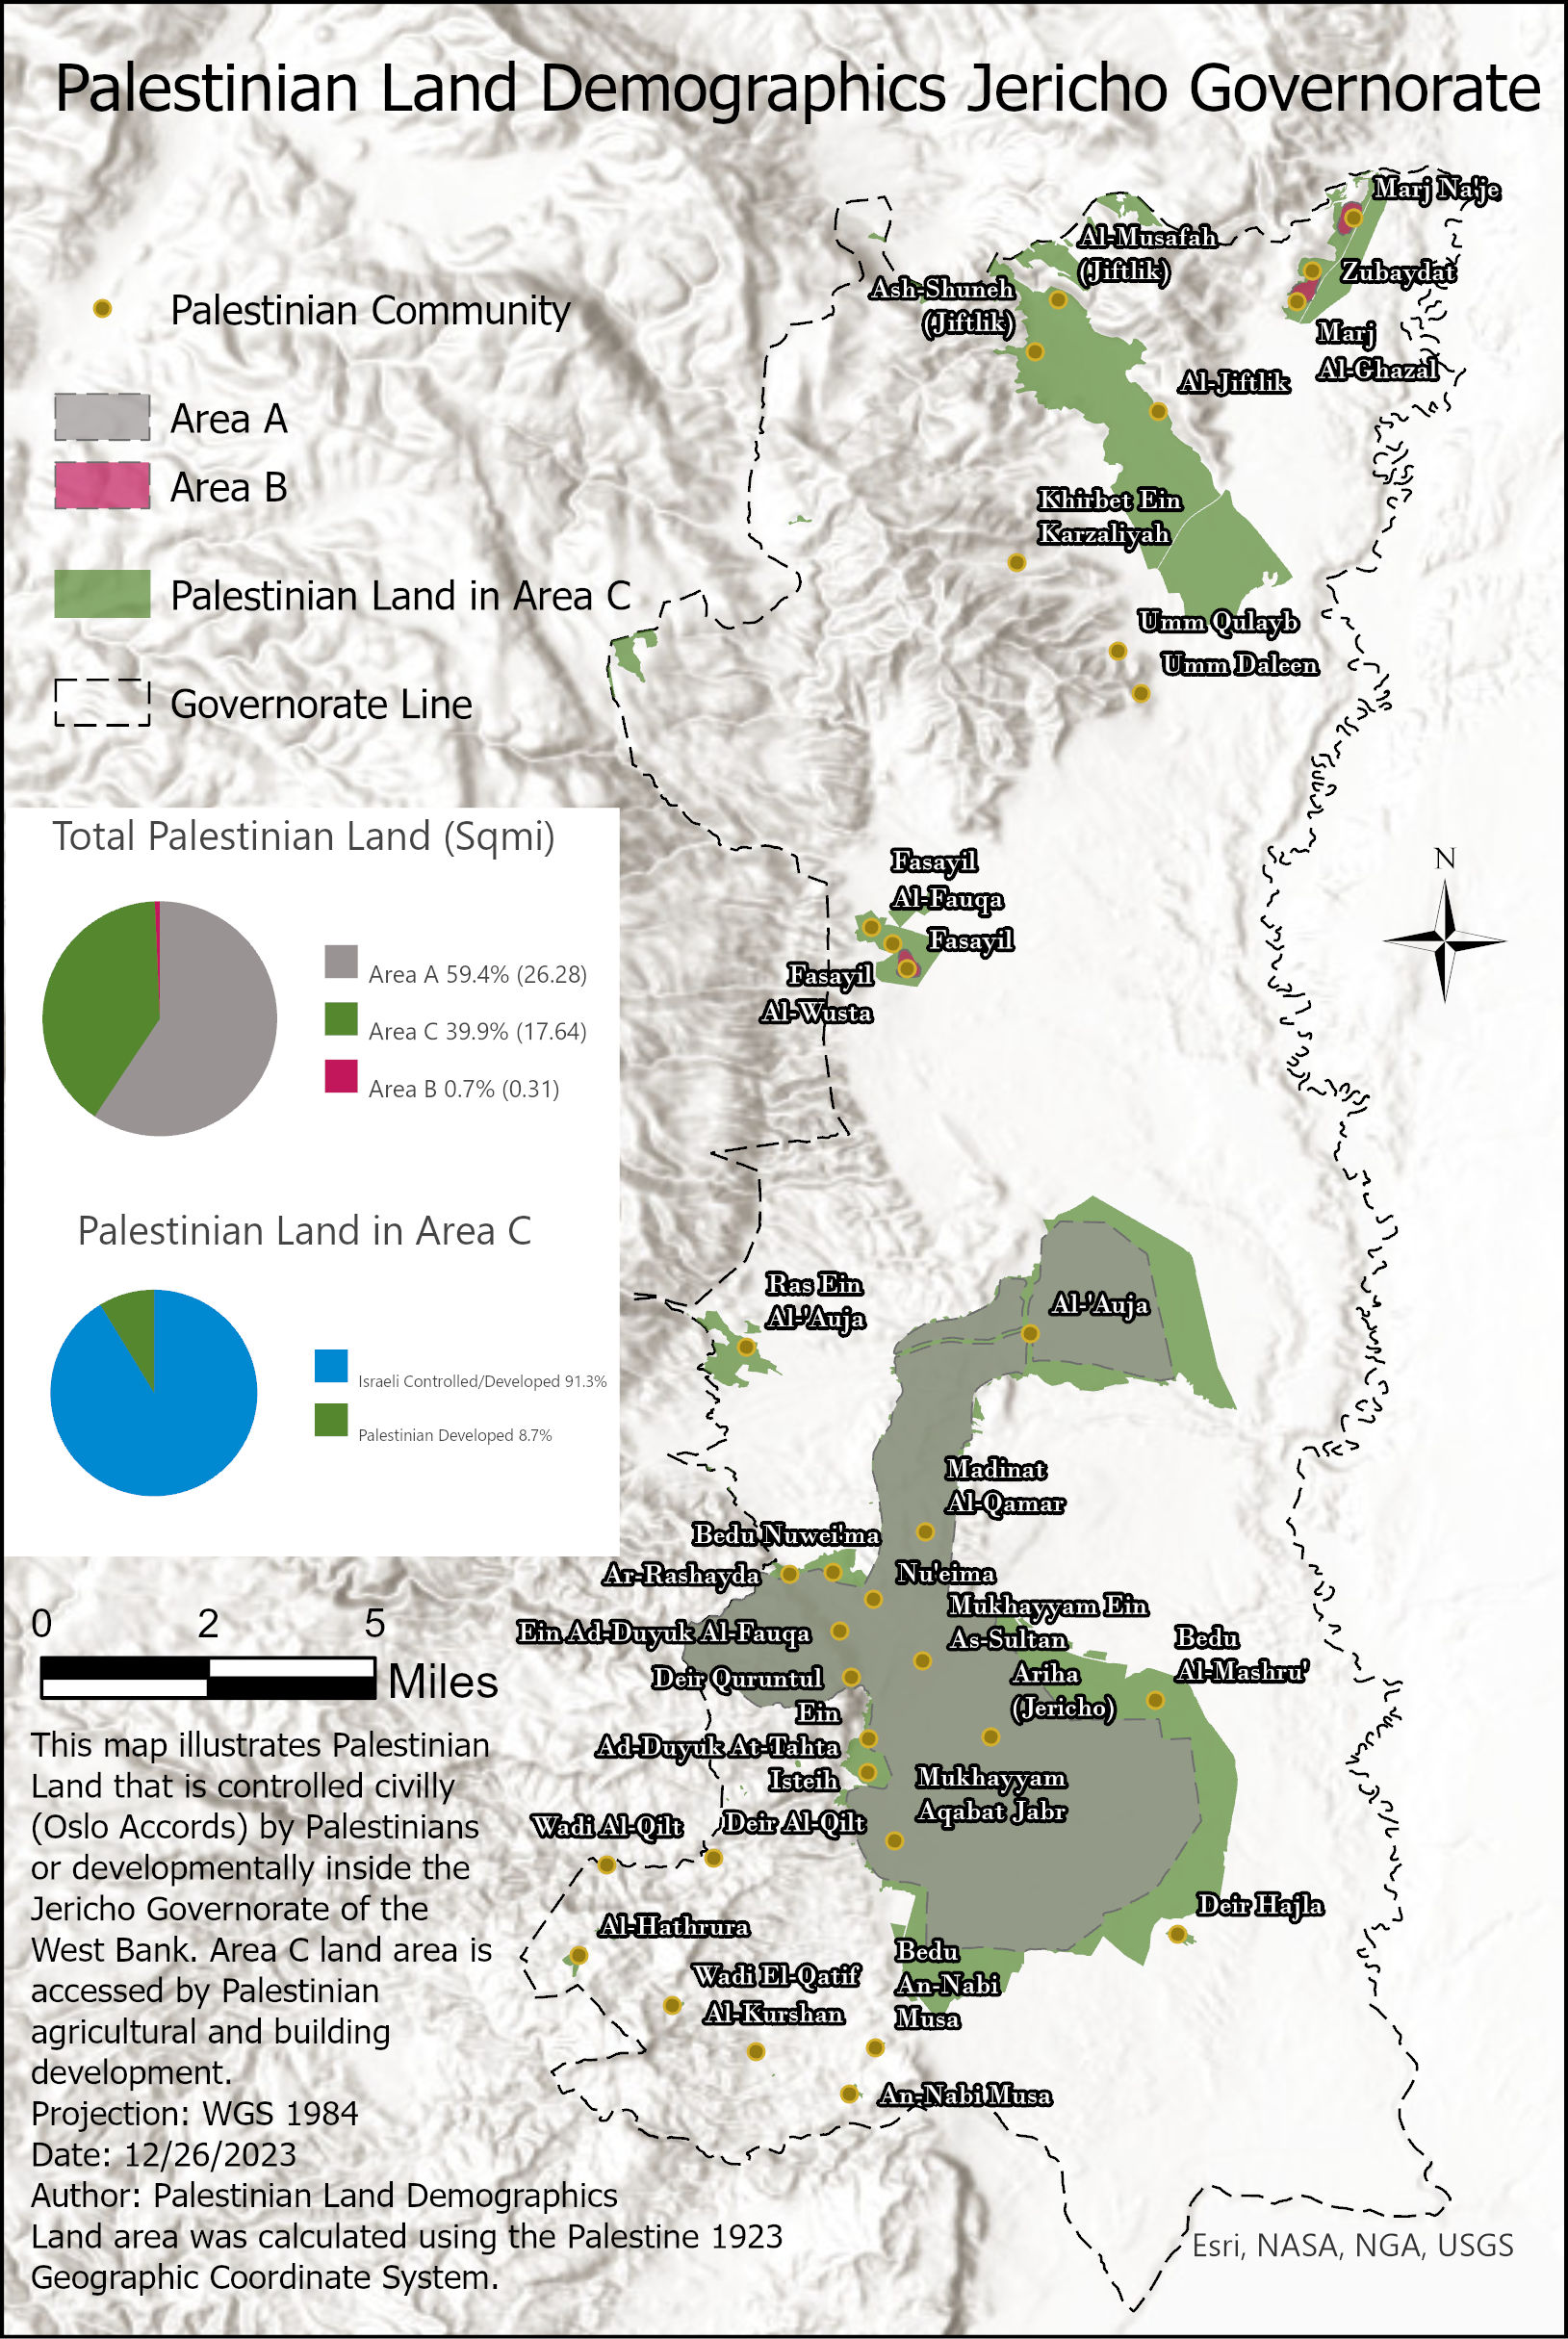
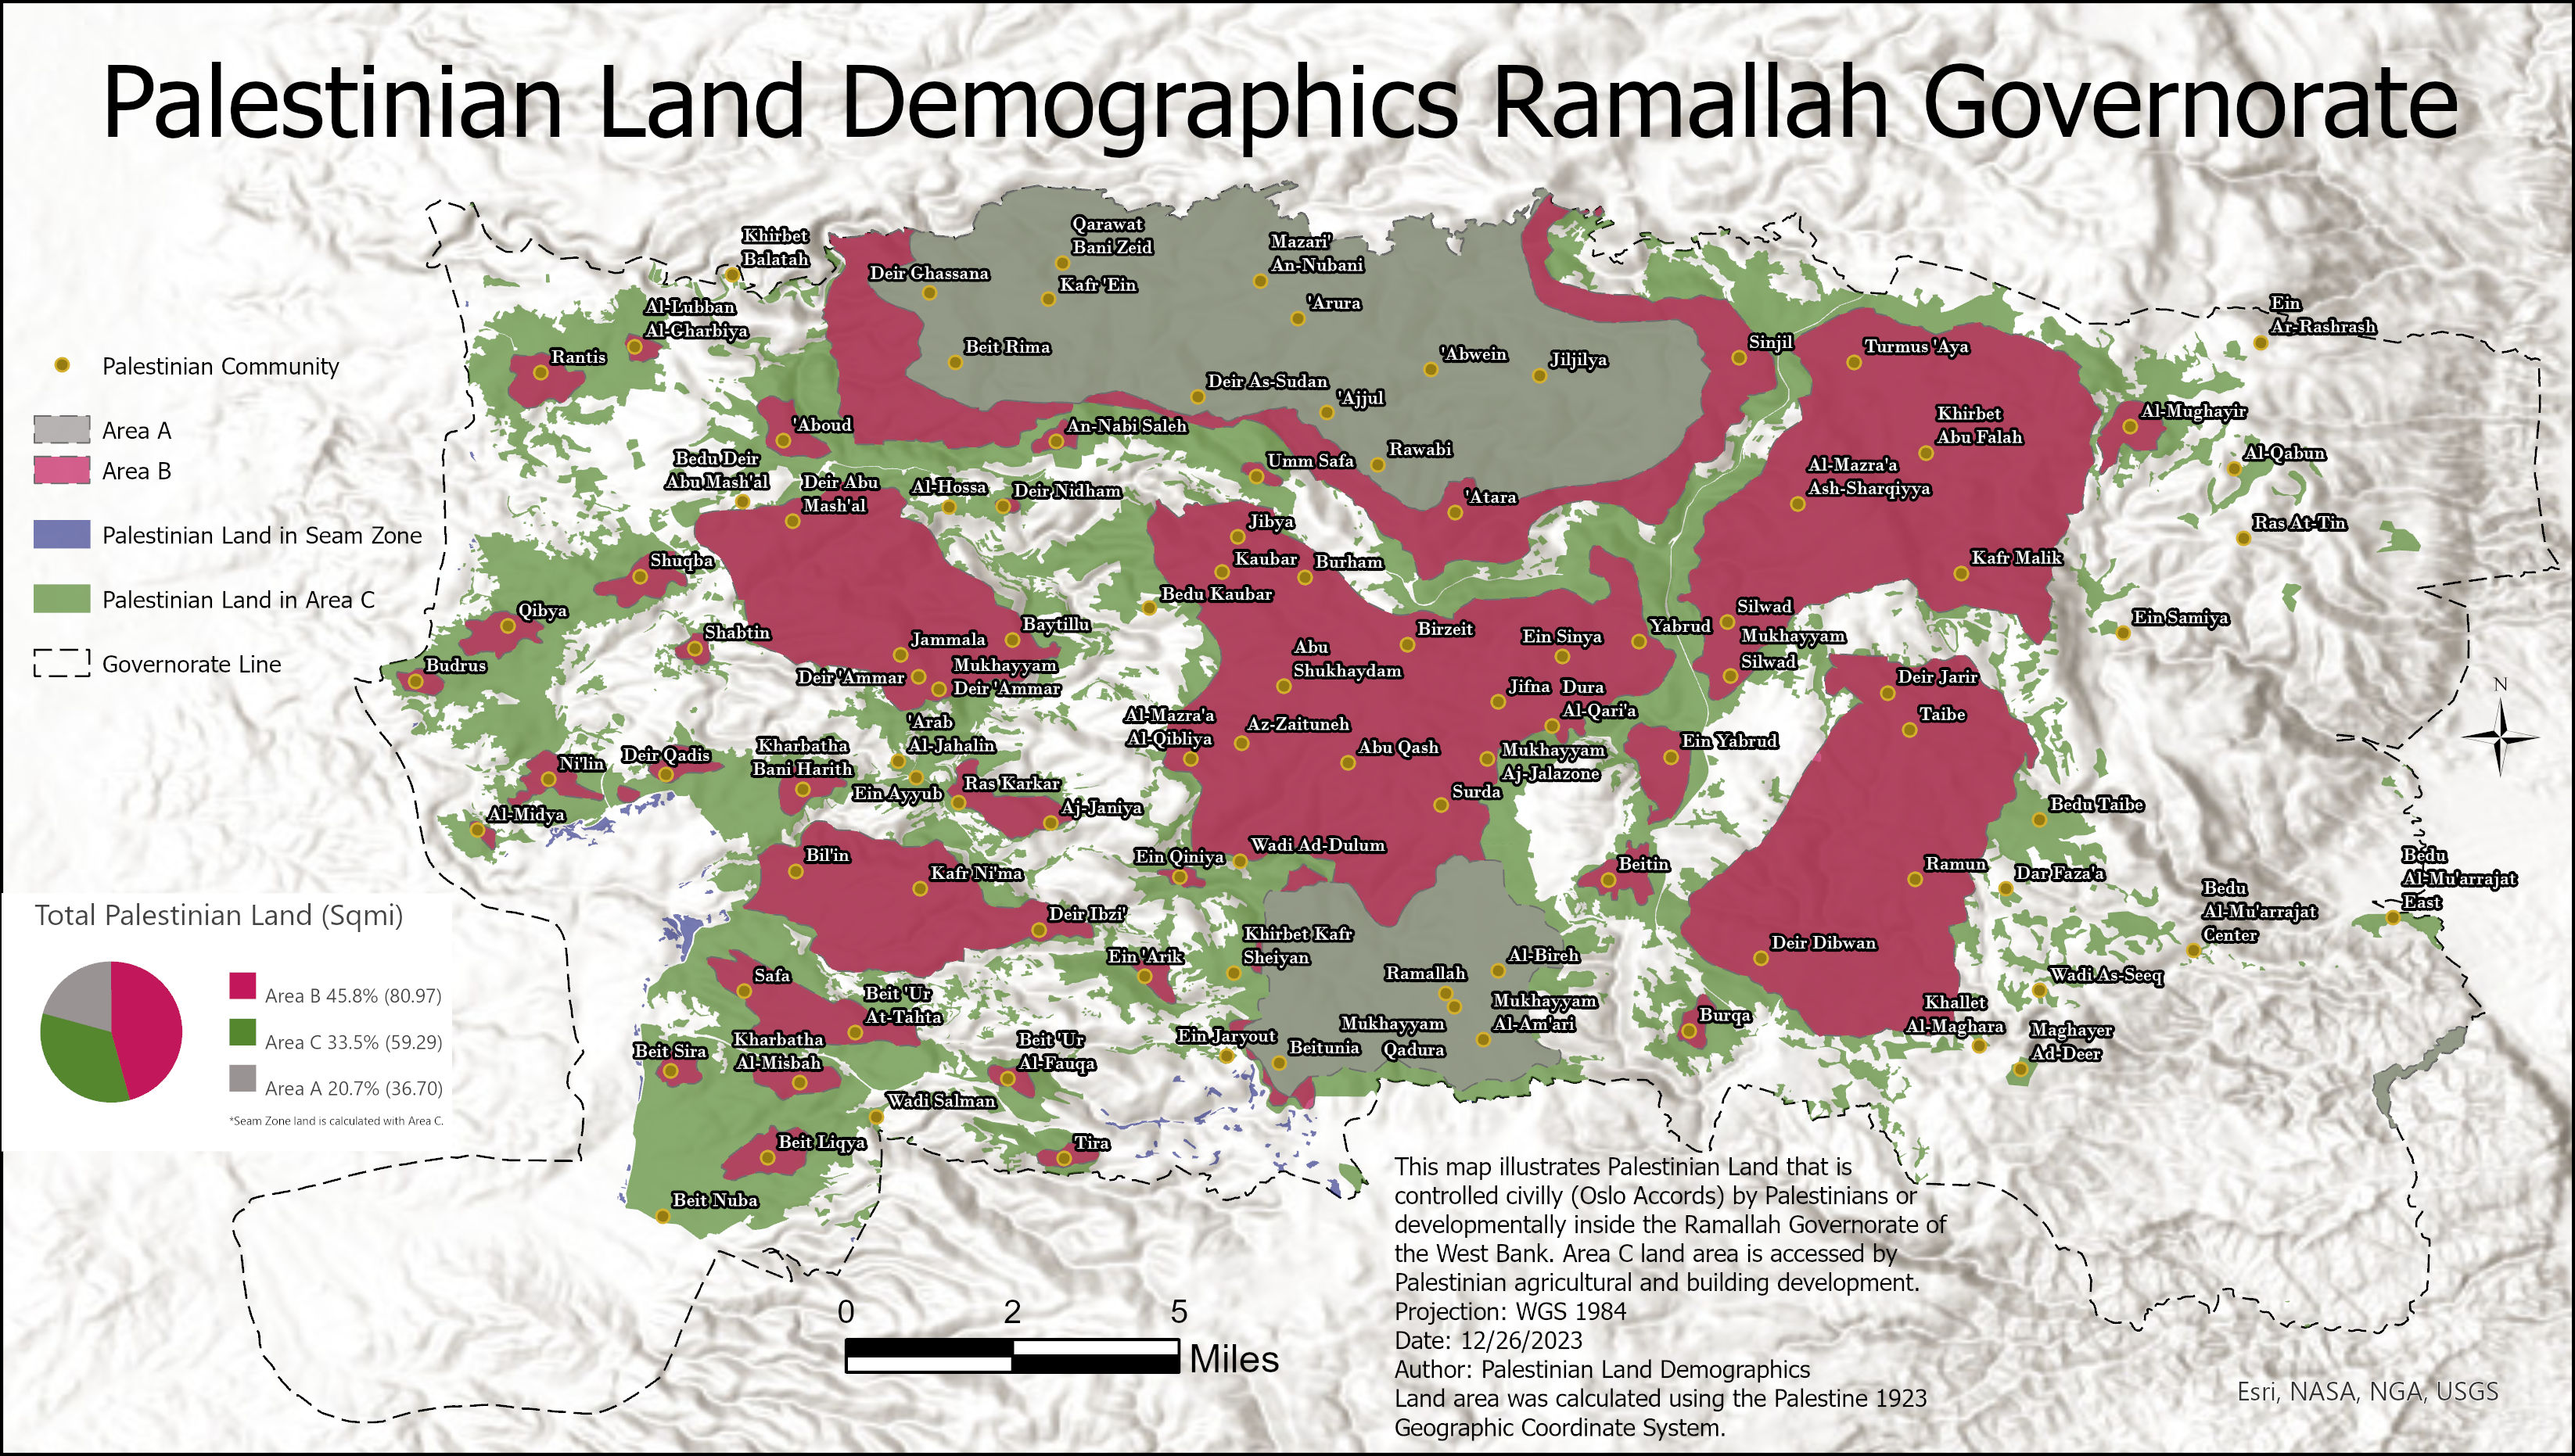
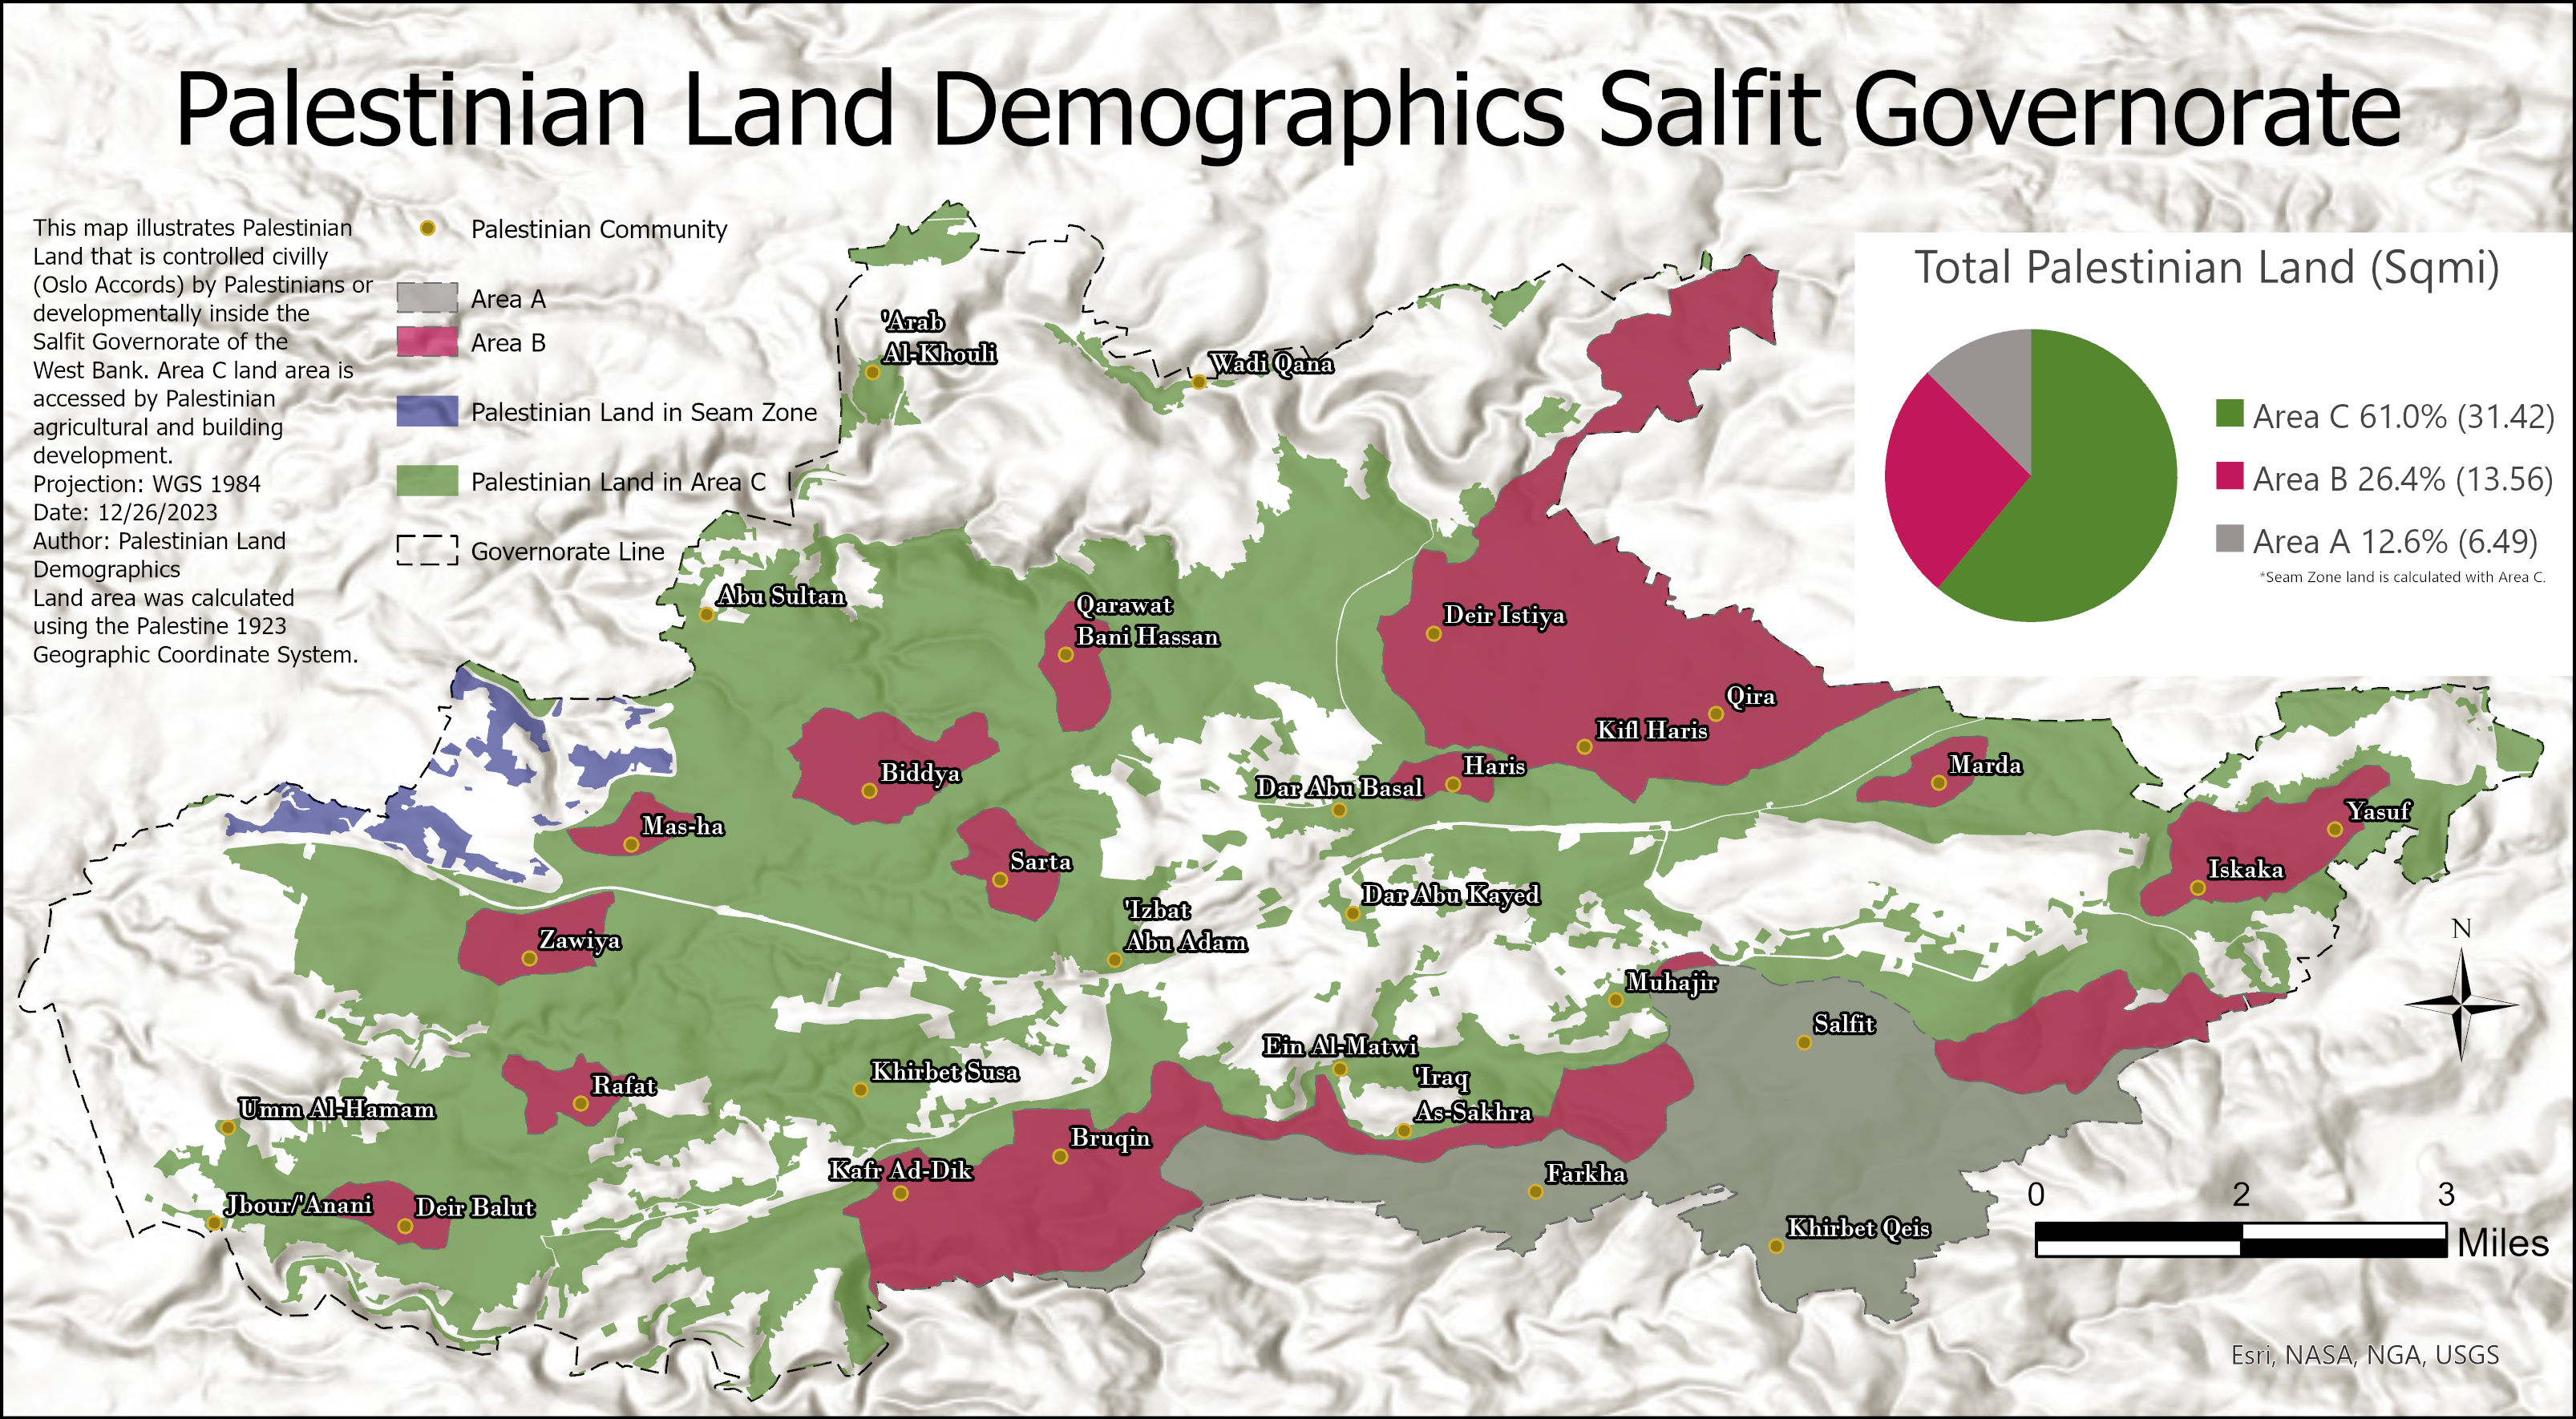
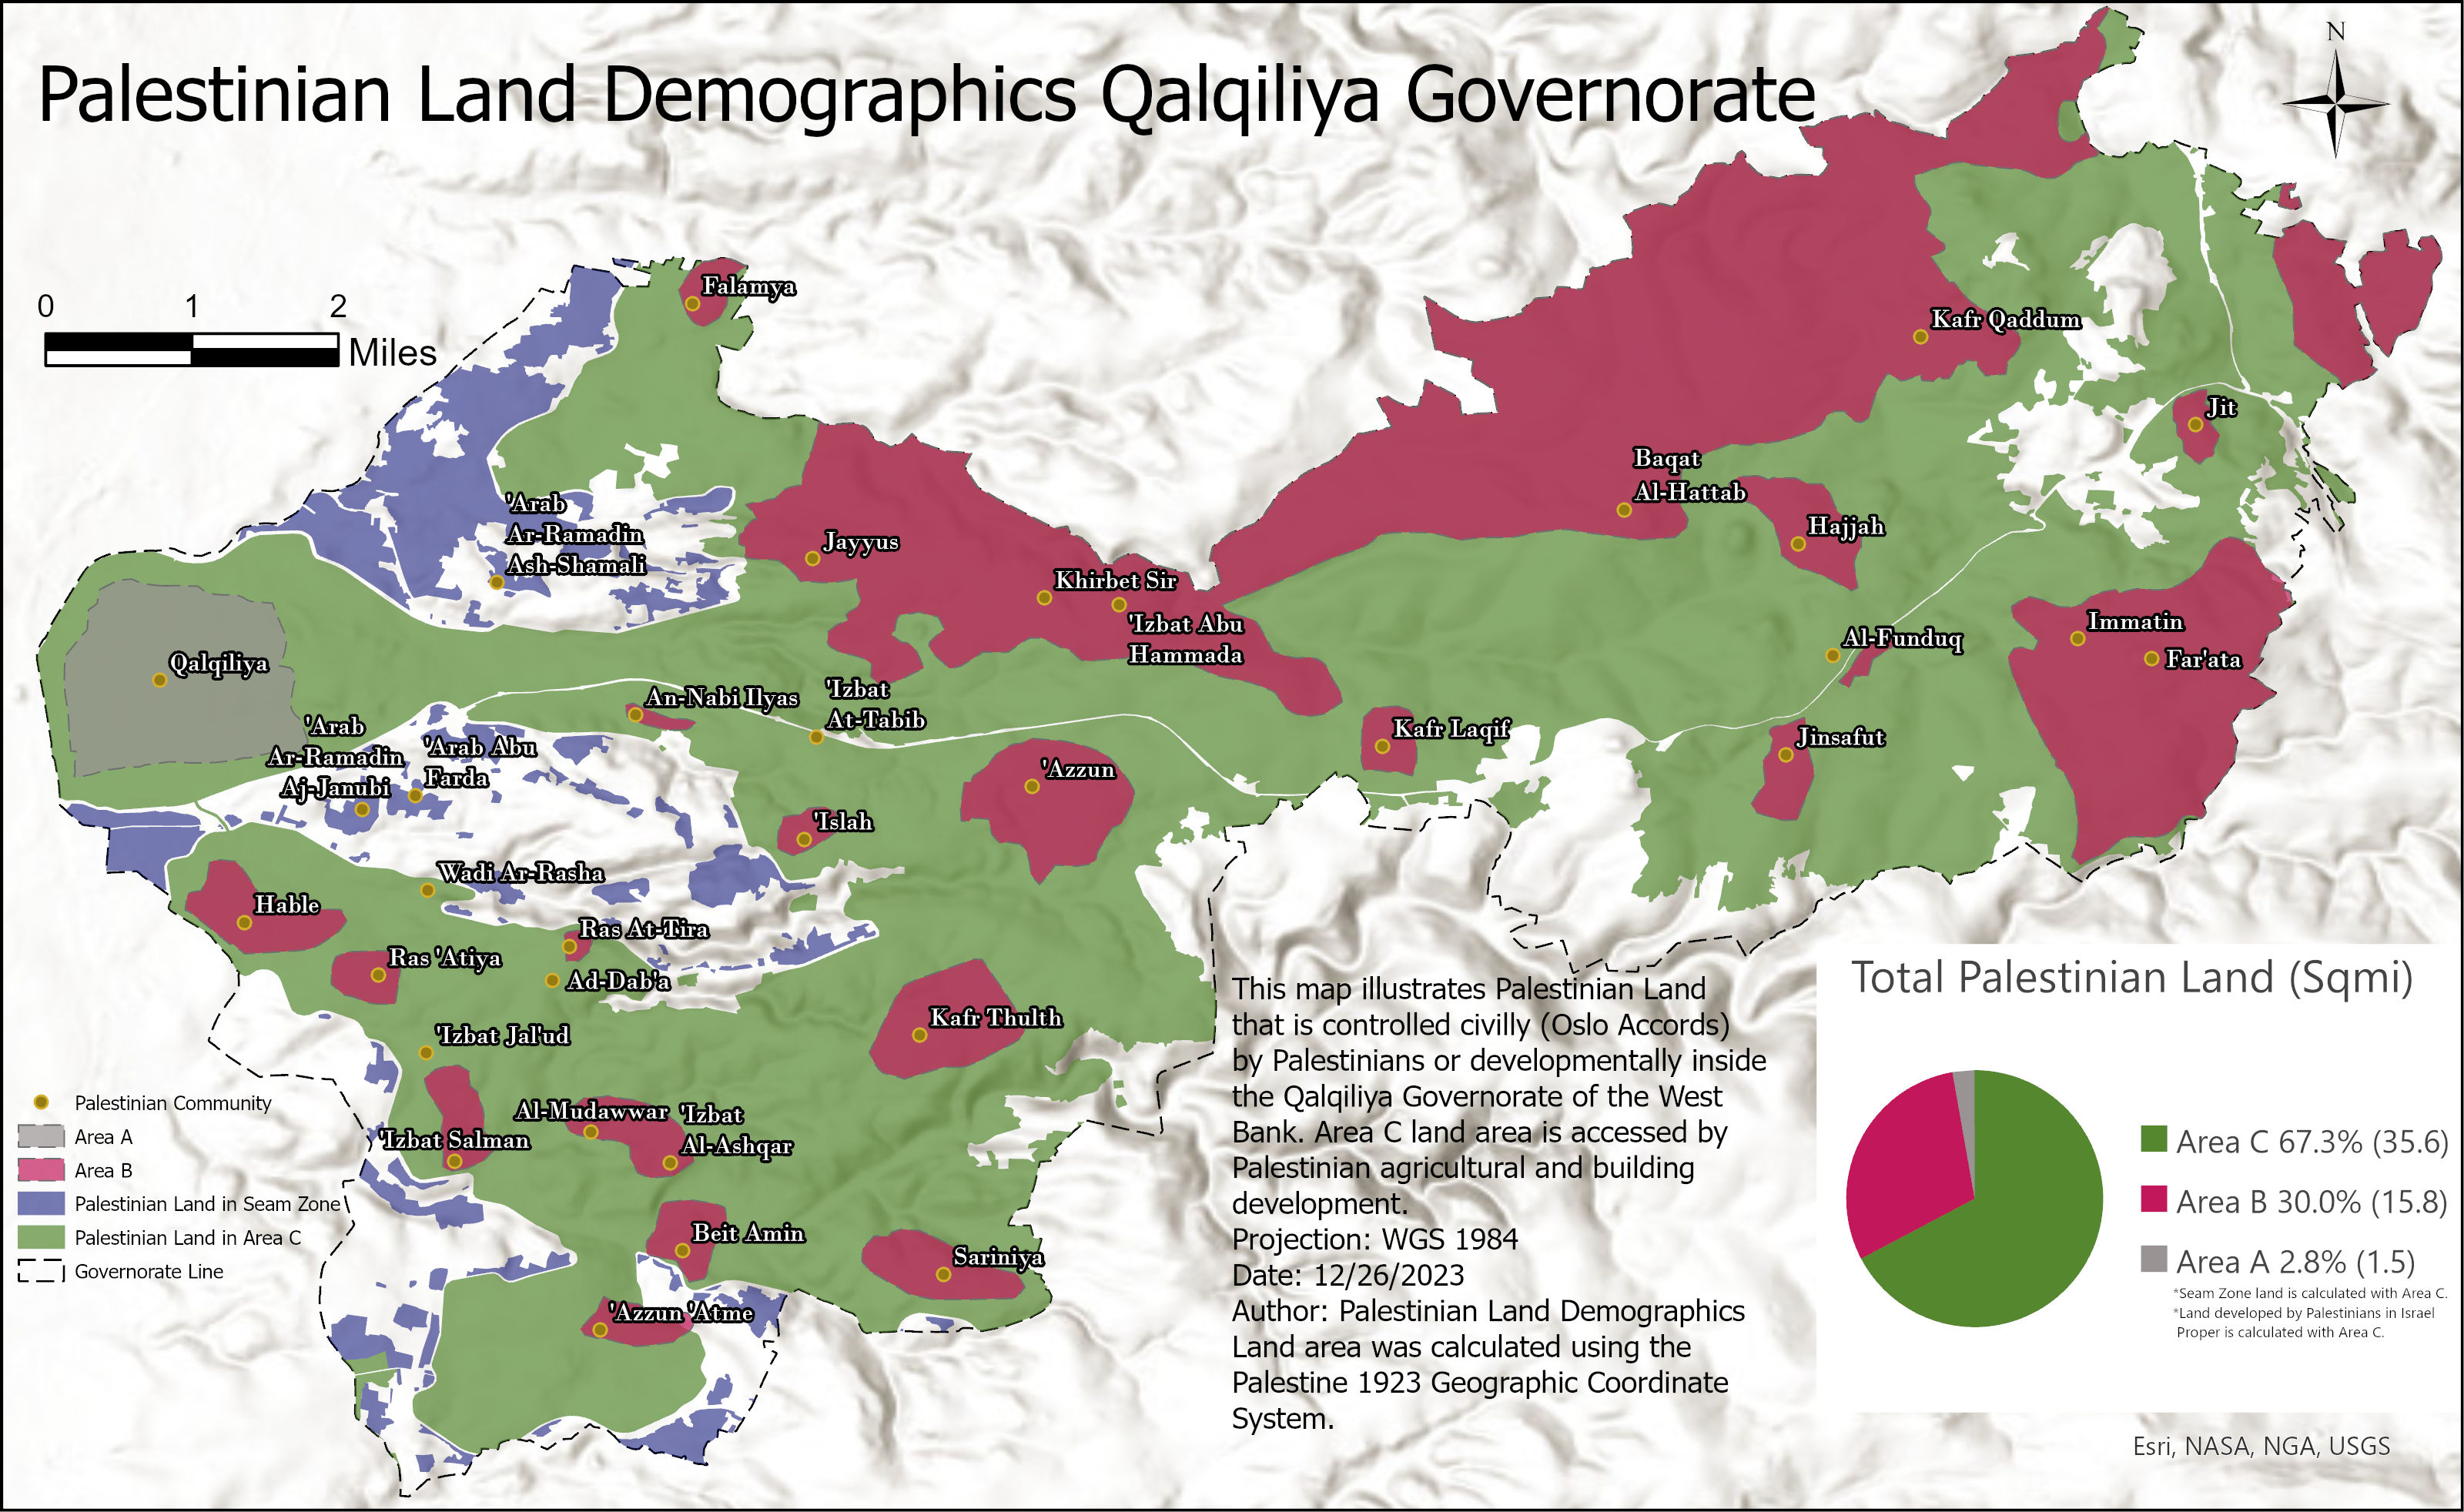
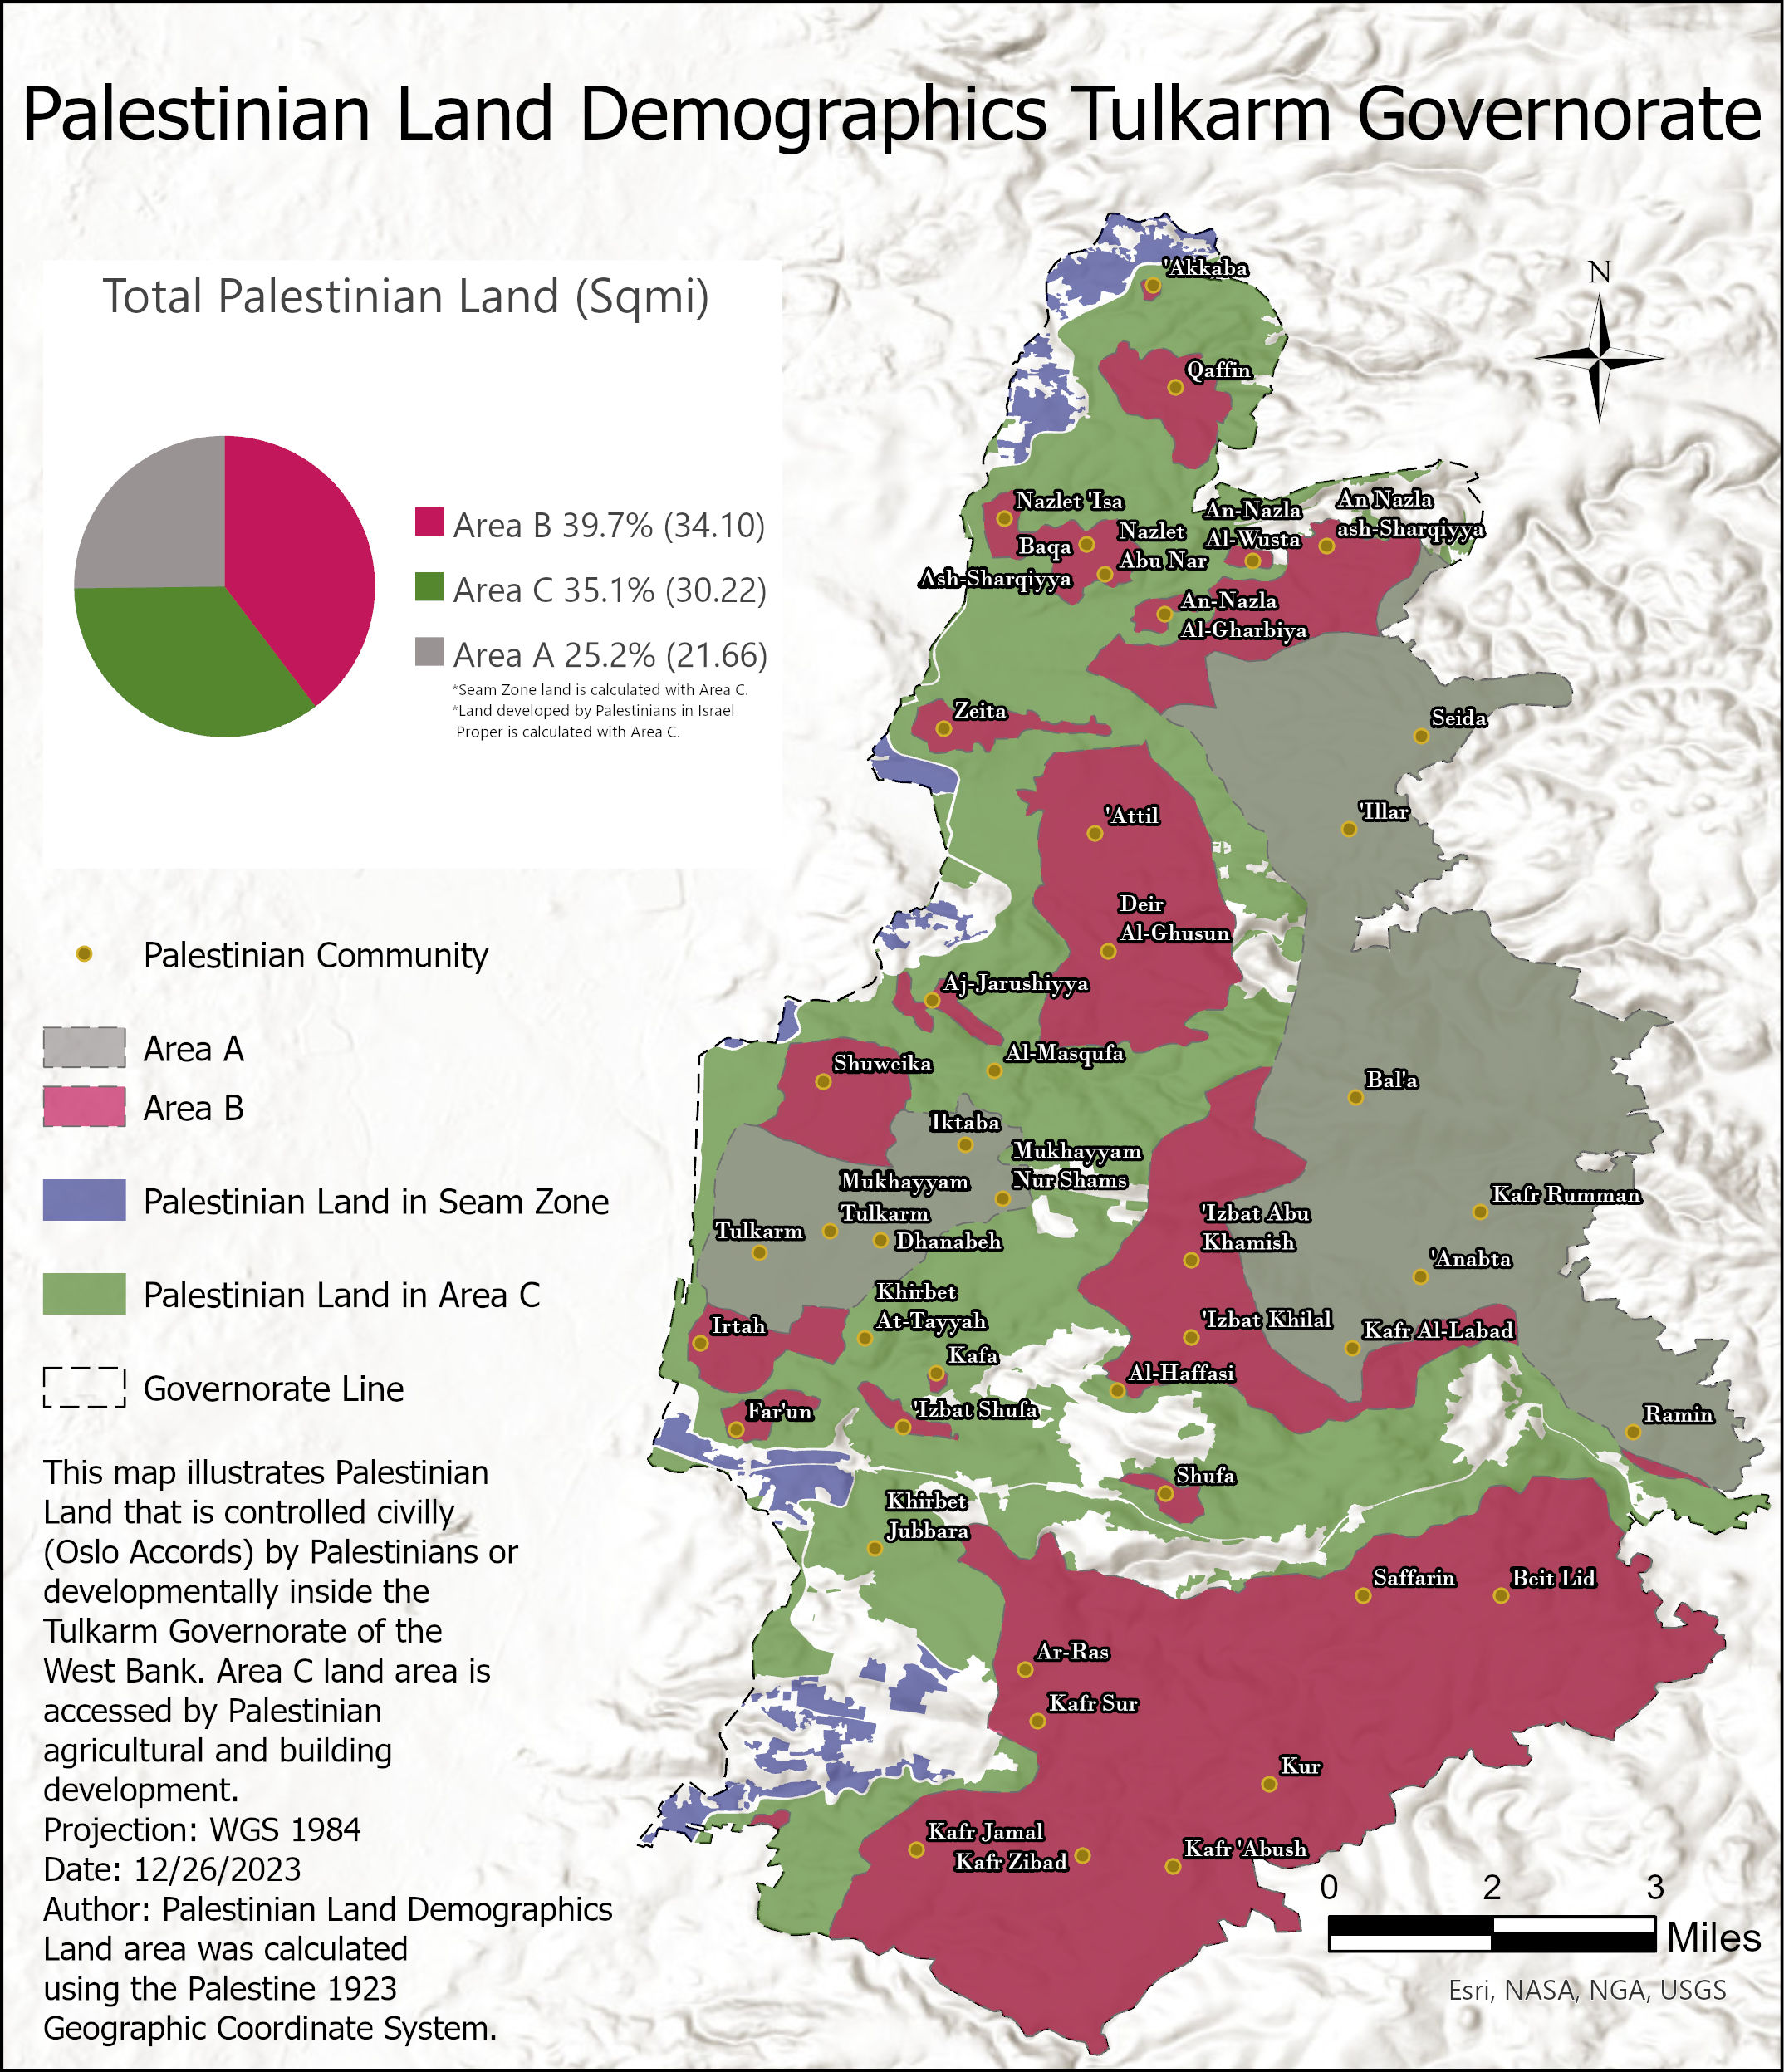
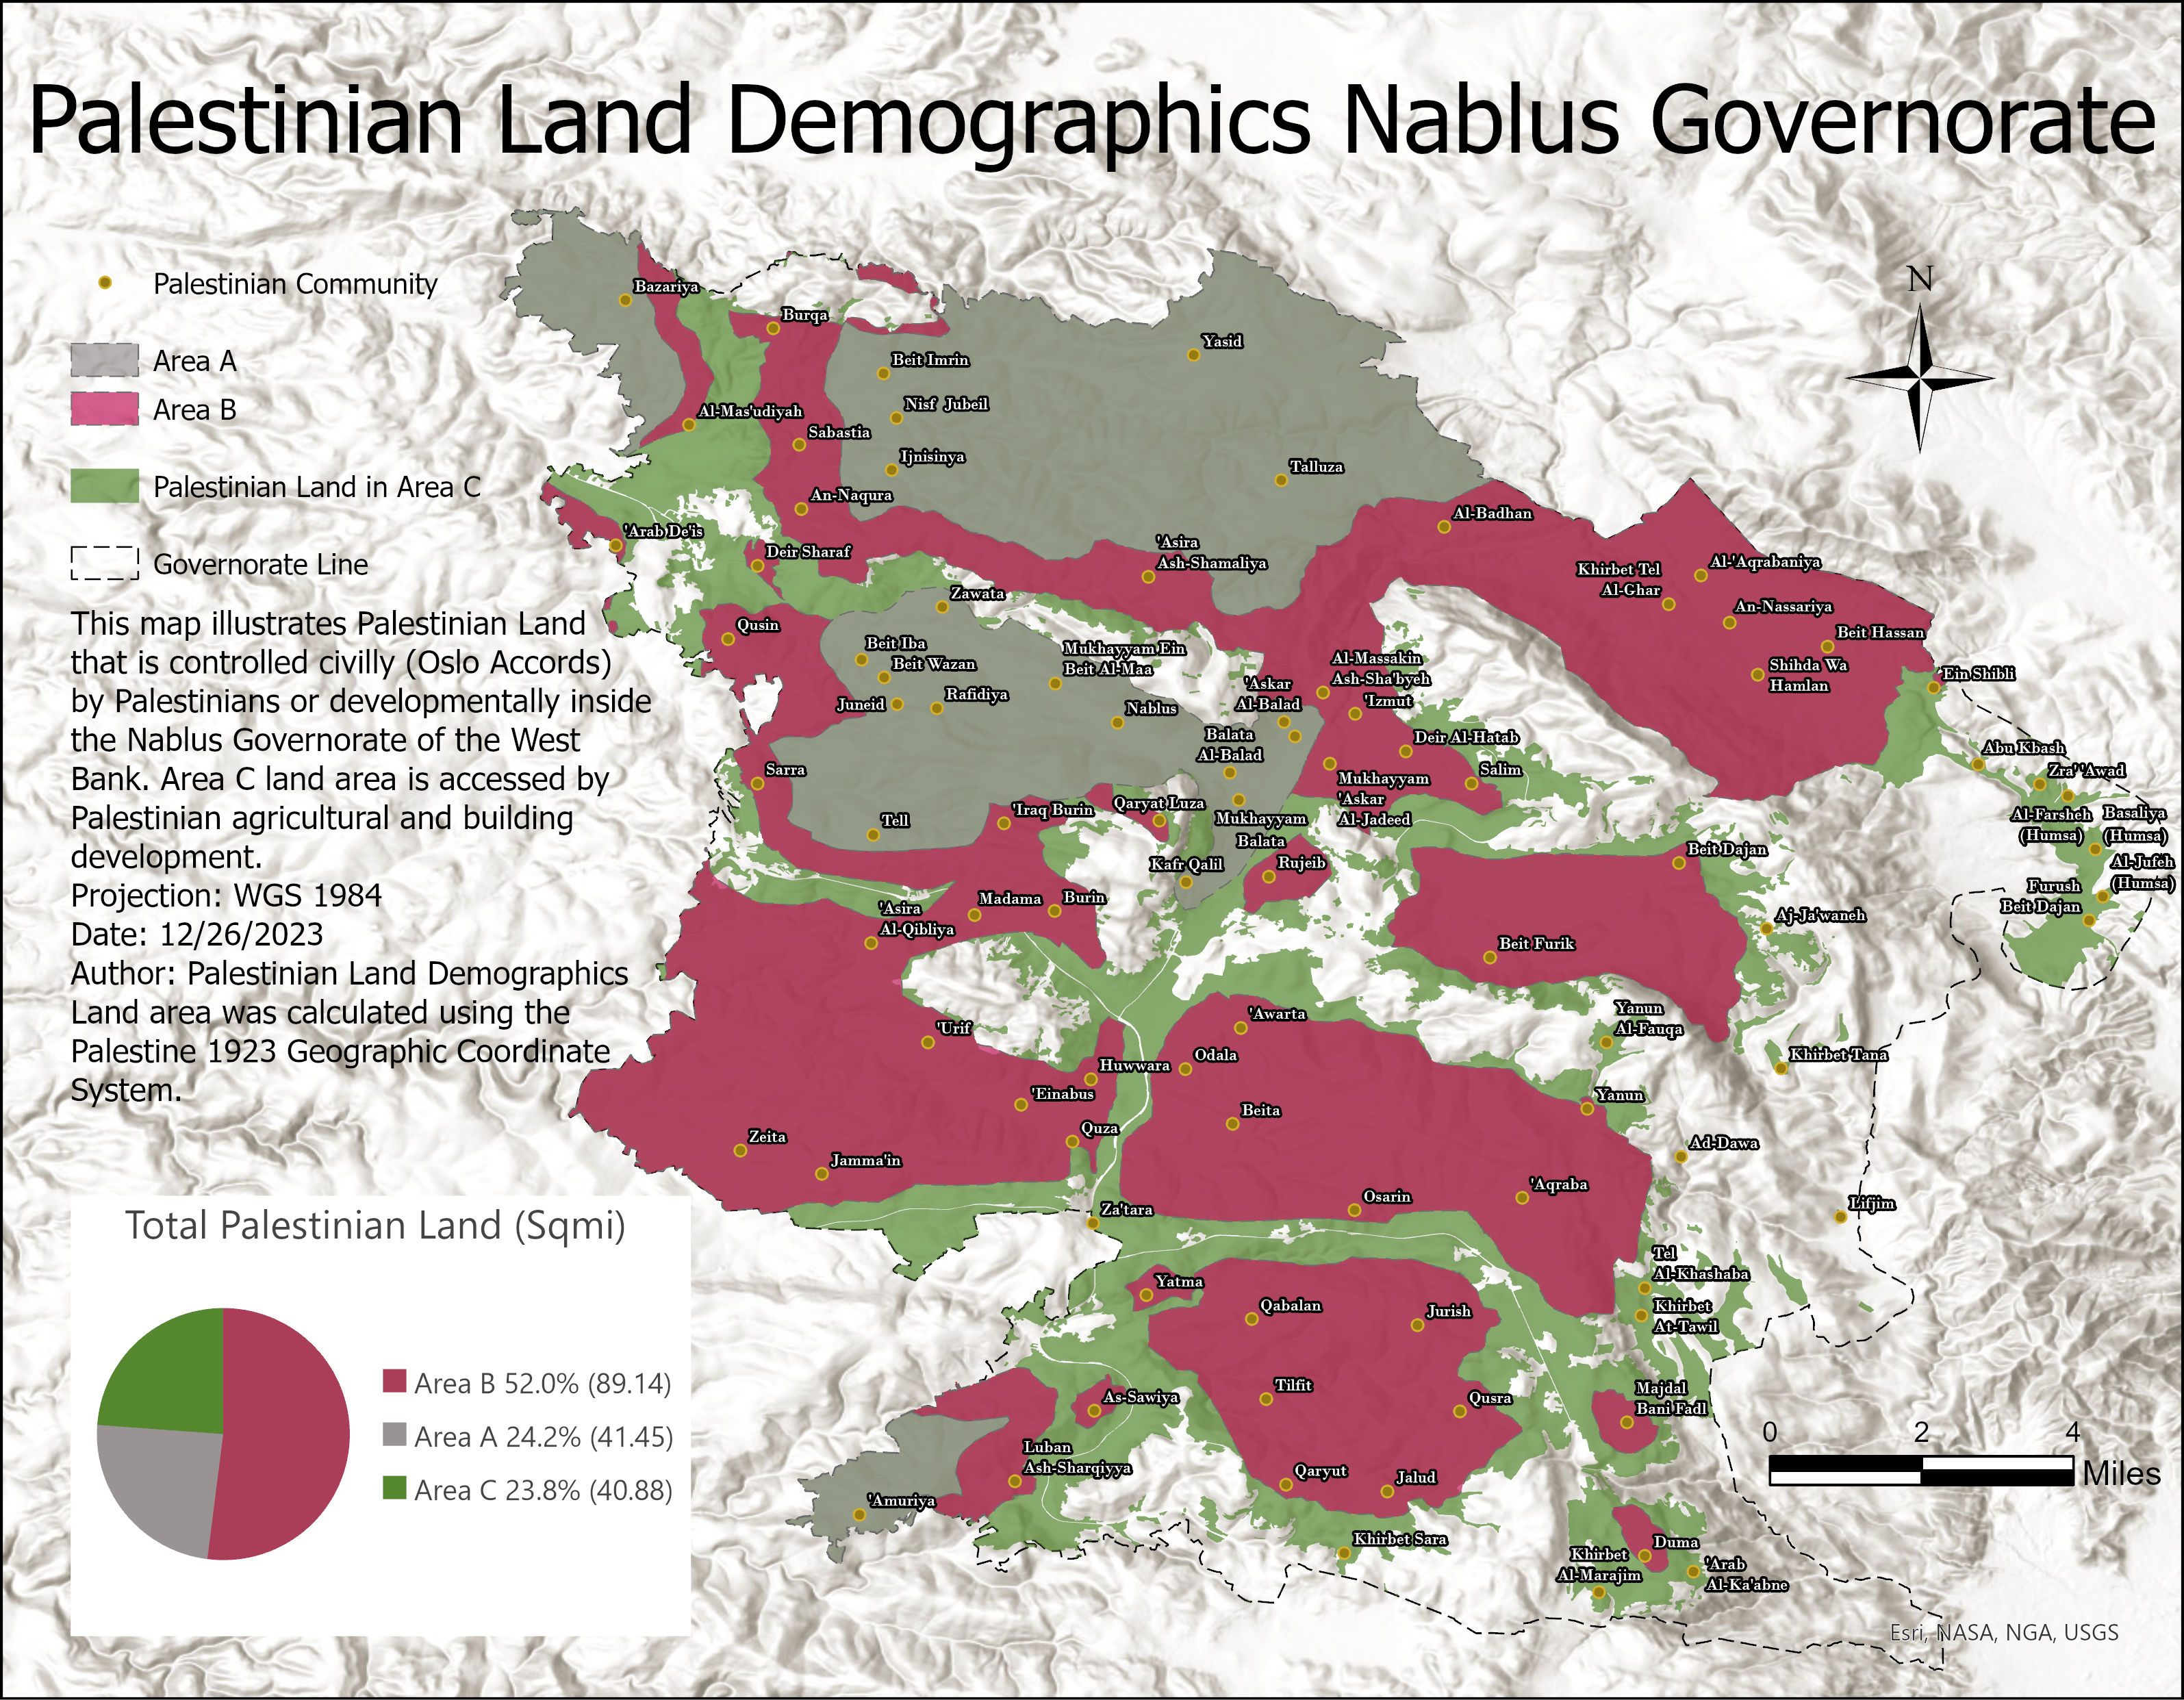
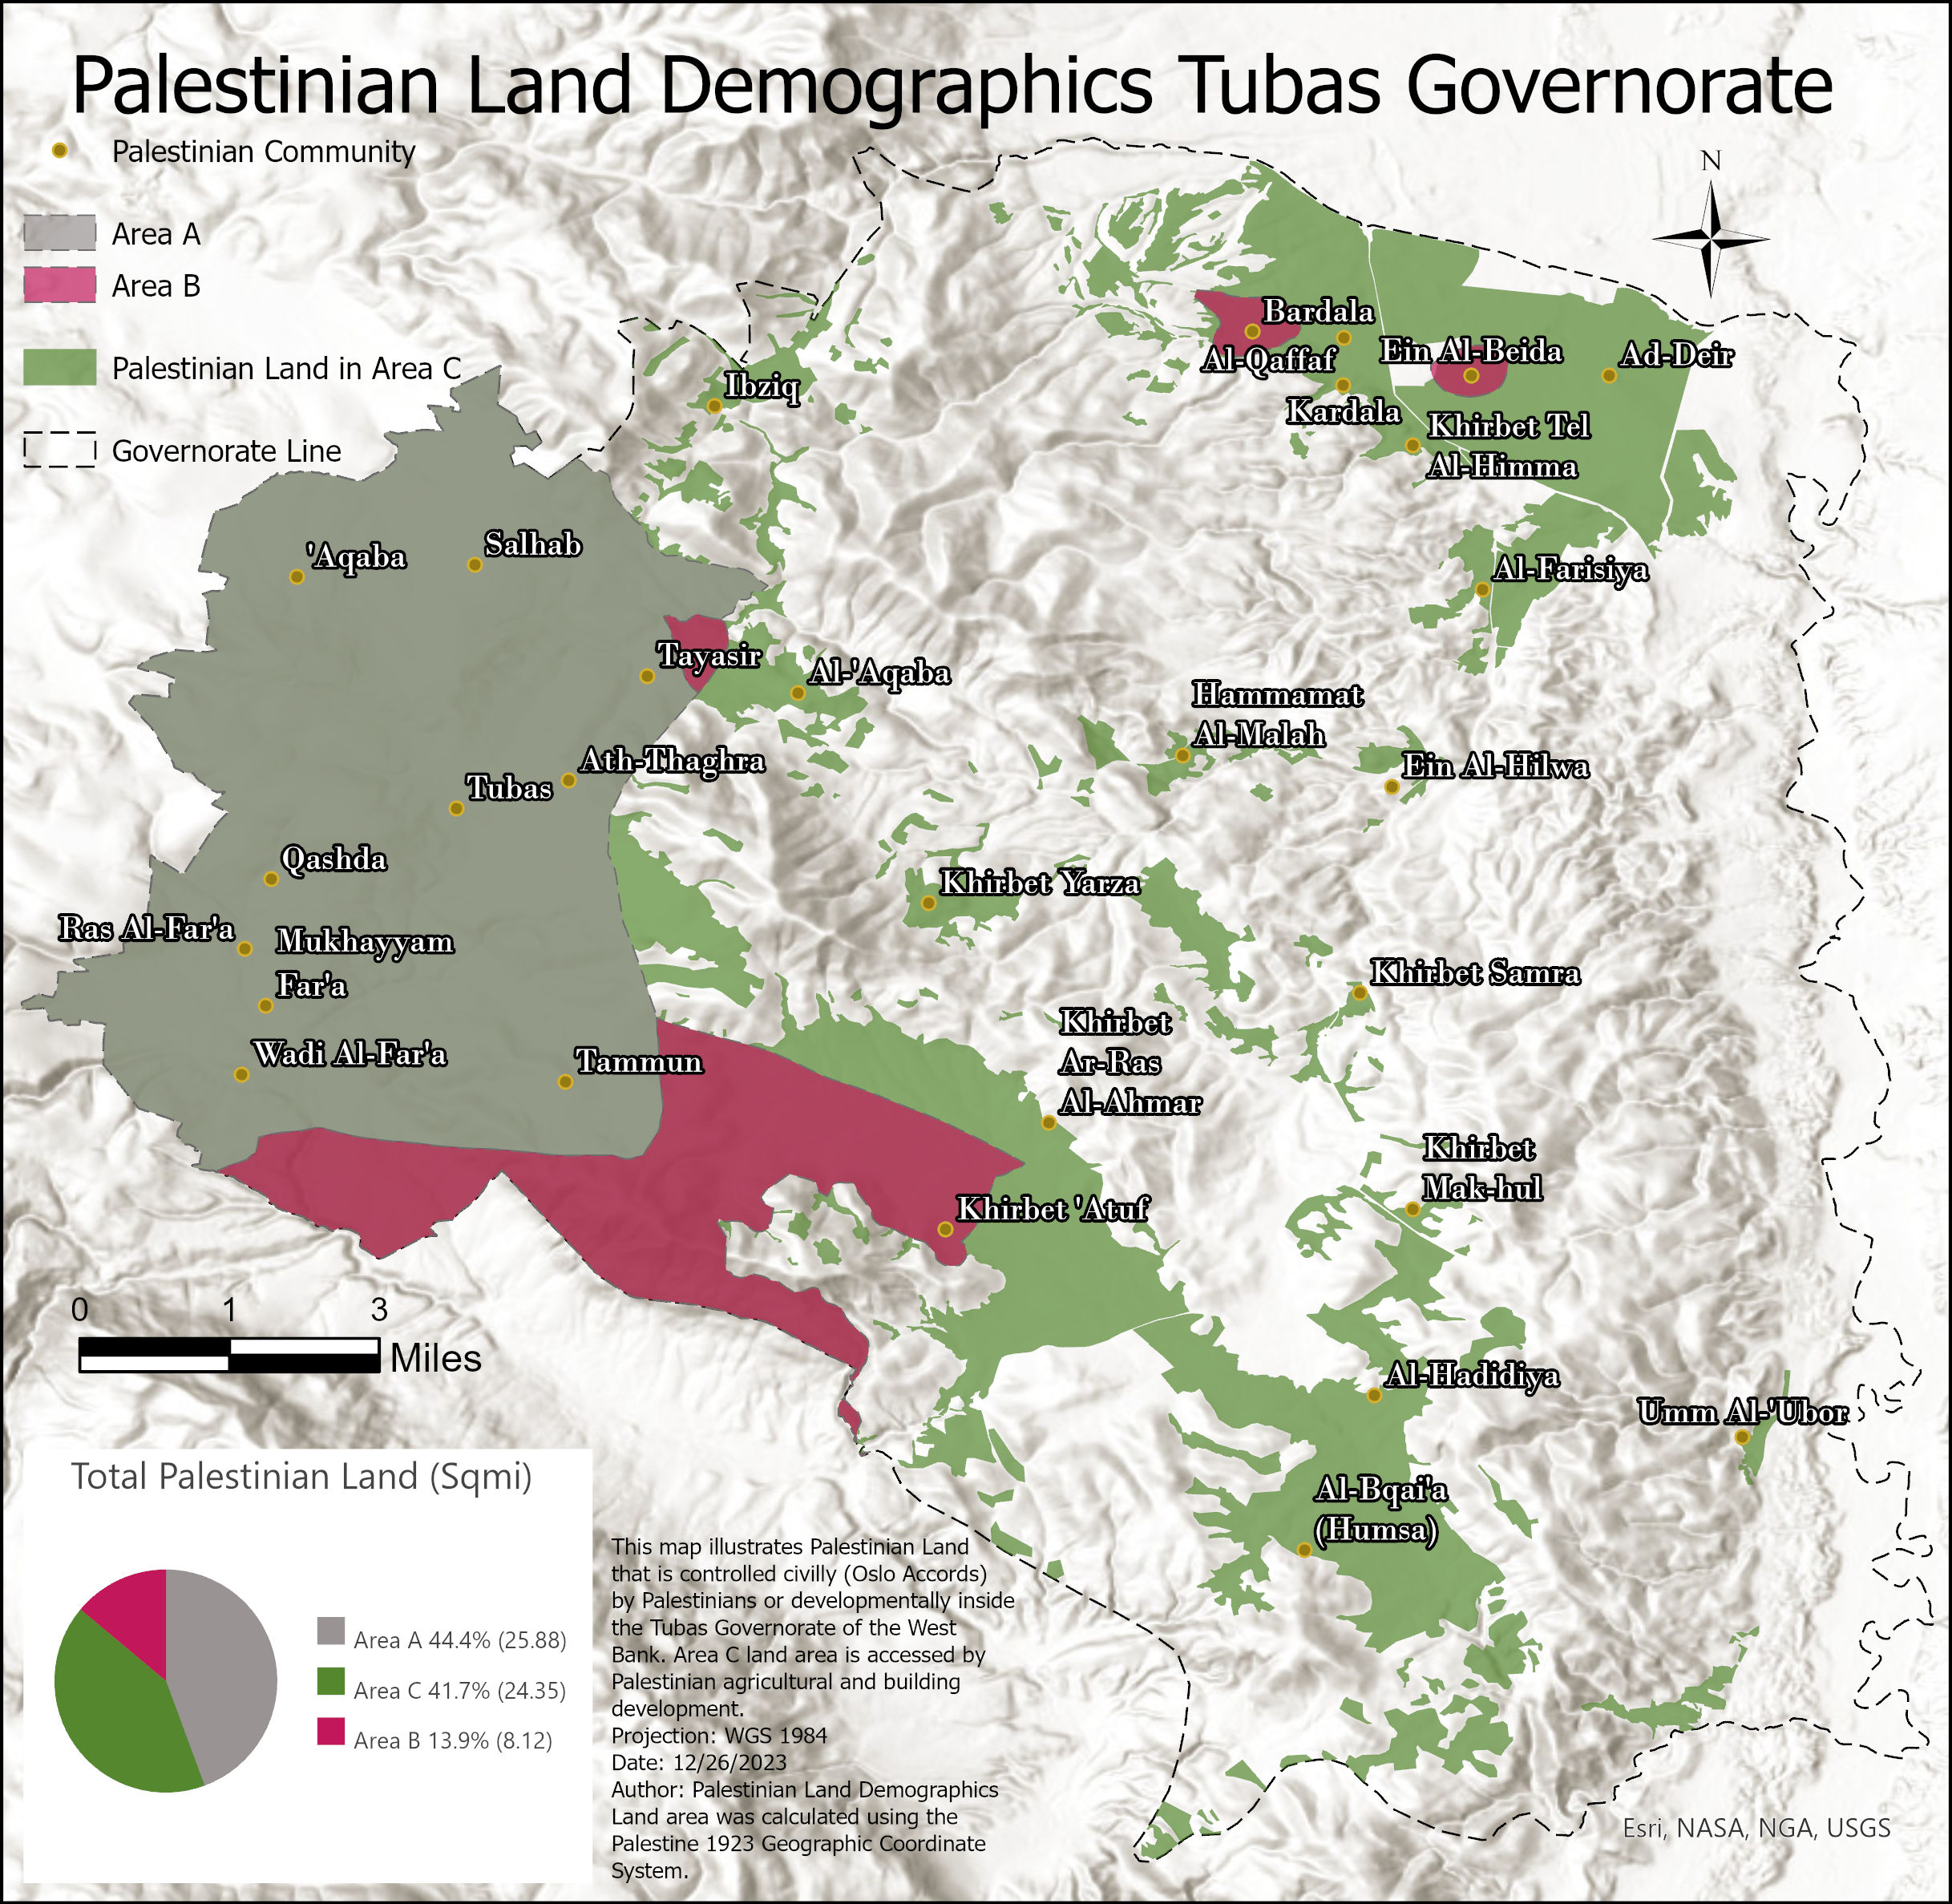
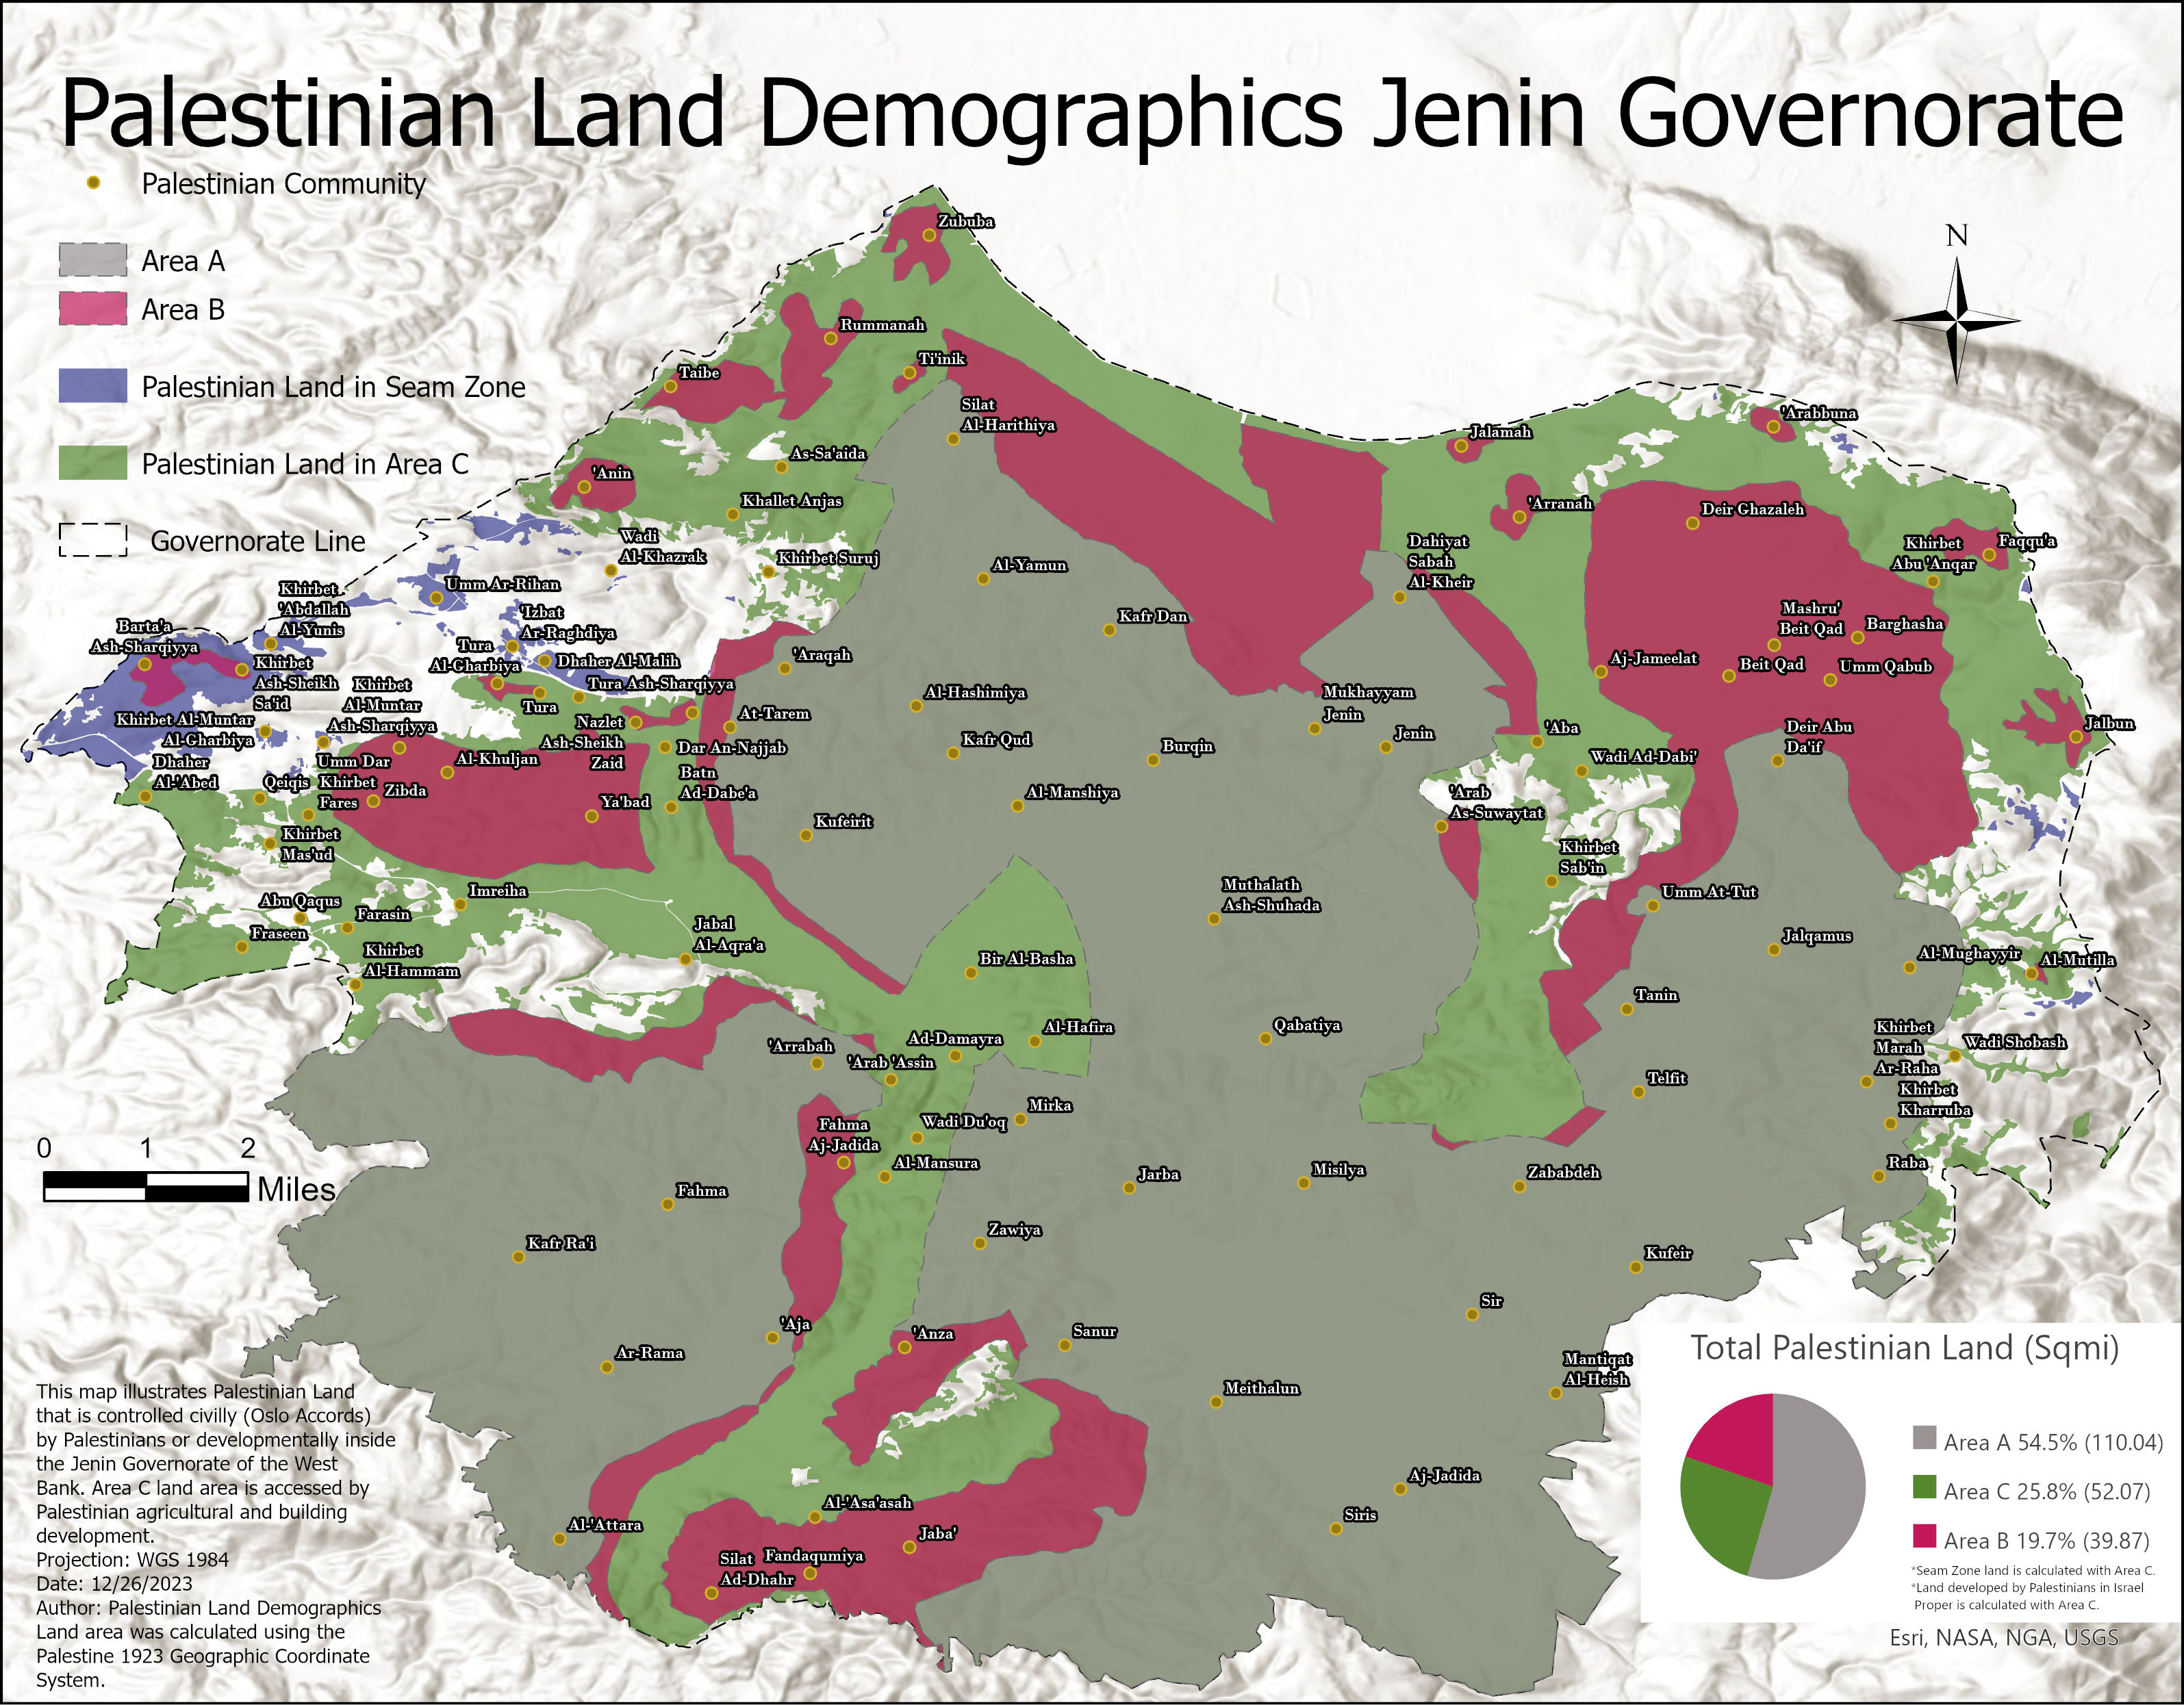
Explore one of the most comprehensive and up-to-date interactive map of Palestinian and Israeli land development. Our project provides statistics and an interactive map that showcases Palestinian developed land within the Districts of Israel and Area C of the West Bank, as well as Palestinian controlled land in the Gaza Strip and Areas A and B in the Governorates of the West Bank. Israeli developed land is showcased for Area C of the West Bank. For the best experience inside the West Bank, keep the borders as defined by the Oslo II Agreement layer turned on to visualize Palestinian developed land in Area C.
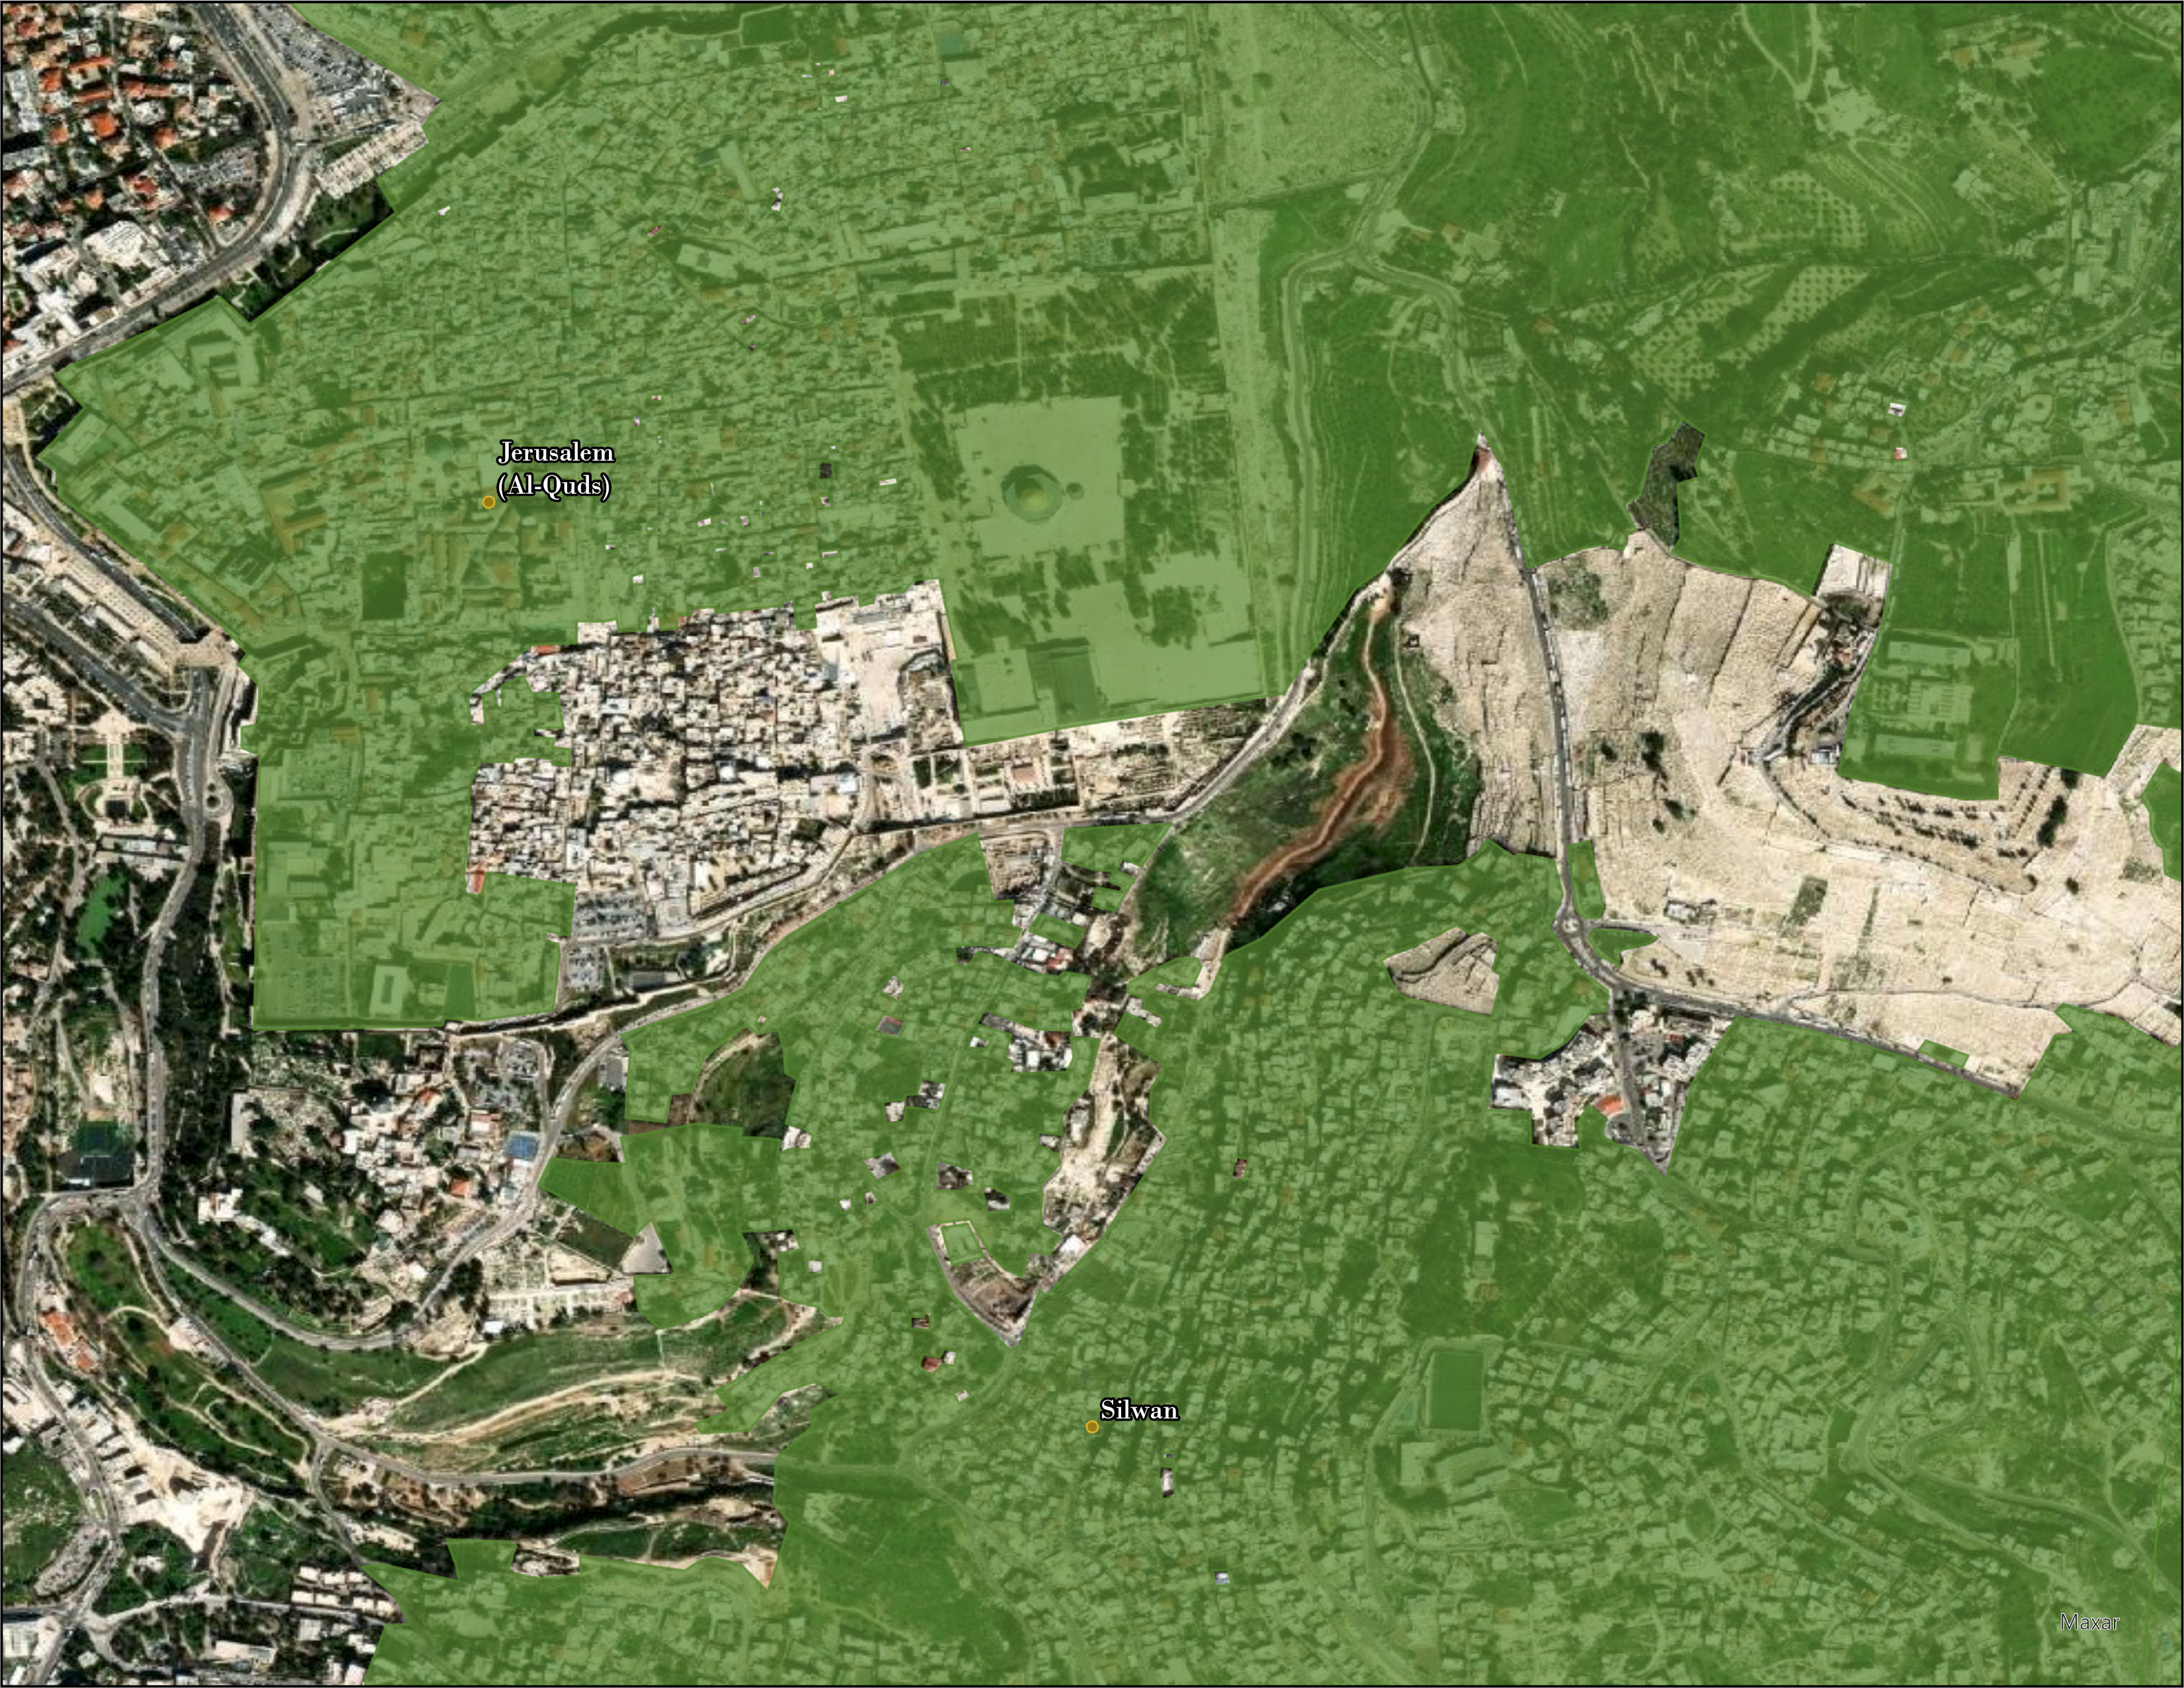
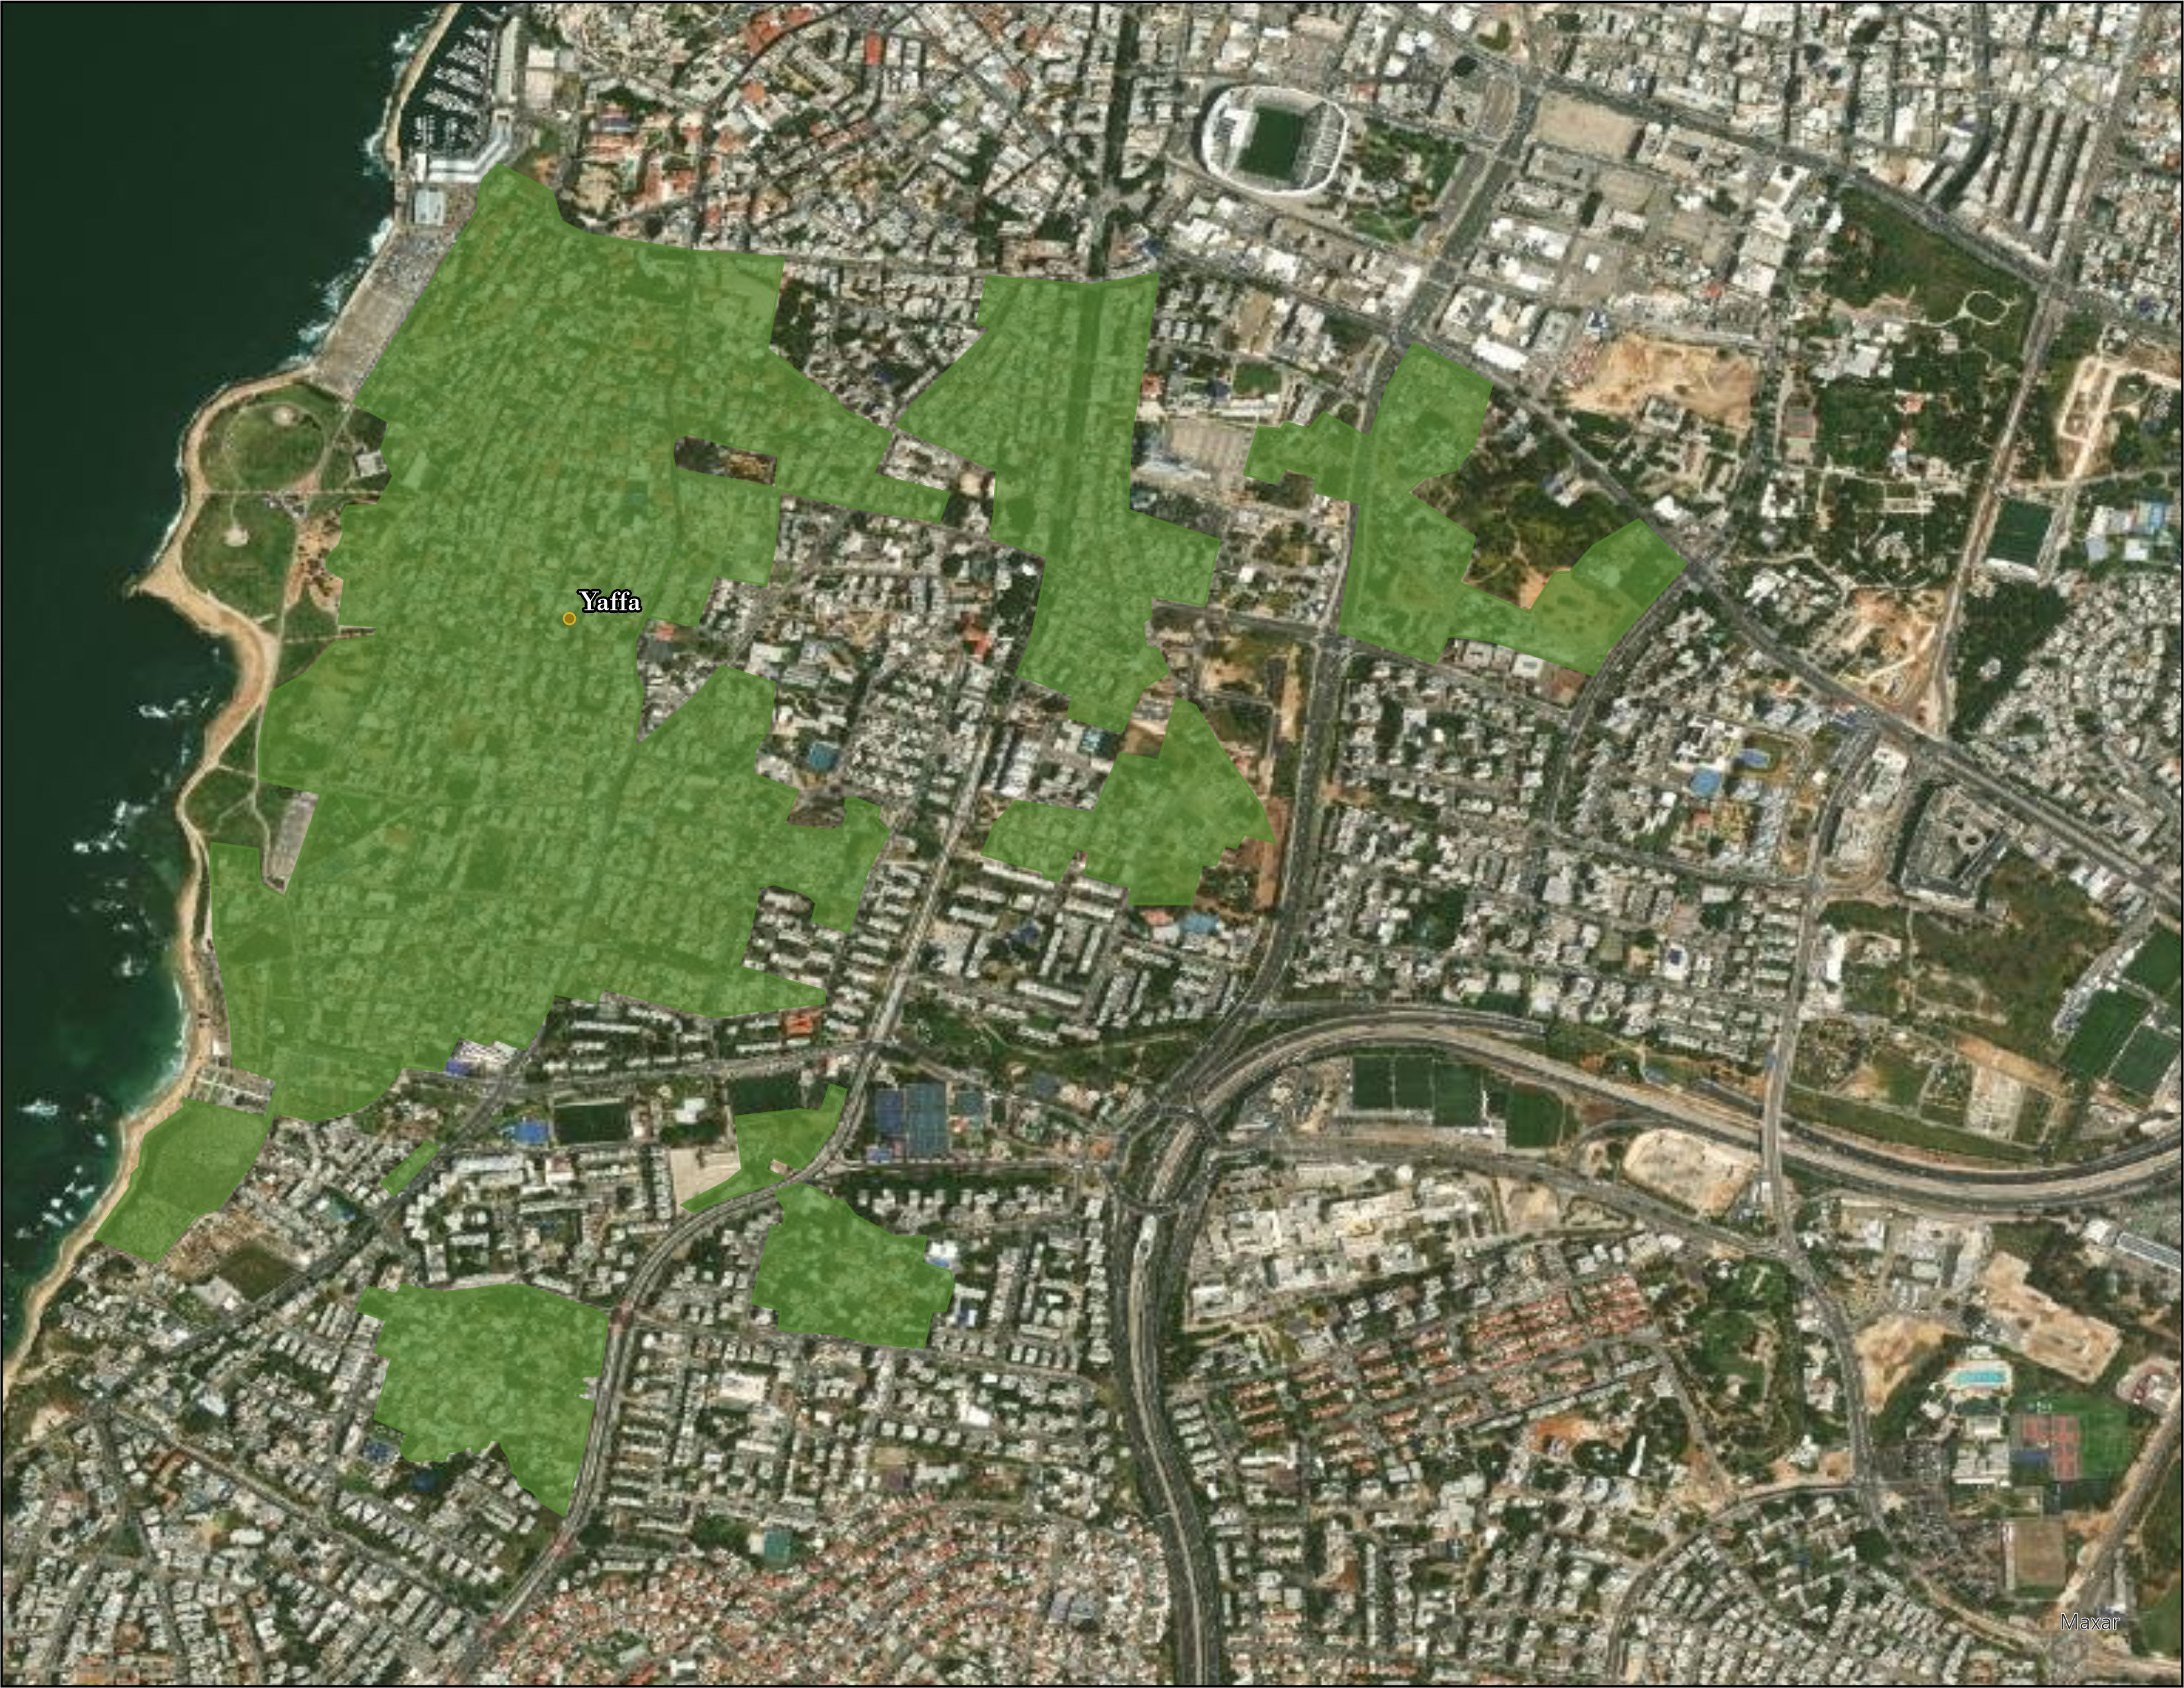
Our interactive map also includes a Palestinian communities layer, Israeli communities layer, Israeli land developed in the West Bank, Palestinian land developed in the Seam Zone (dark blue), Israel Proper (green), East Jerusalem (green), land controlled in the Gaza Strip (green) as well as boundaries for the Governorates of Palestine and the Districts of Israel.
We update the map every month to reflect changes in satellite imagery or facts on the ground. Our information comes from various human rights groups as well as the Palestinian and Israeli media. Dive in now to discover the intricate patterns of Palestinian land development.
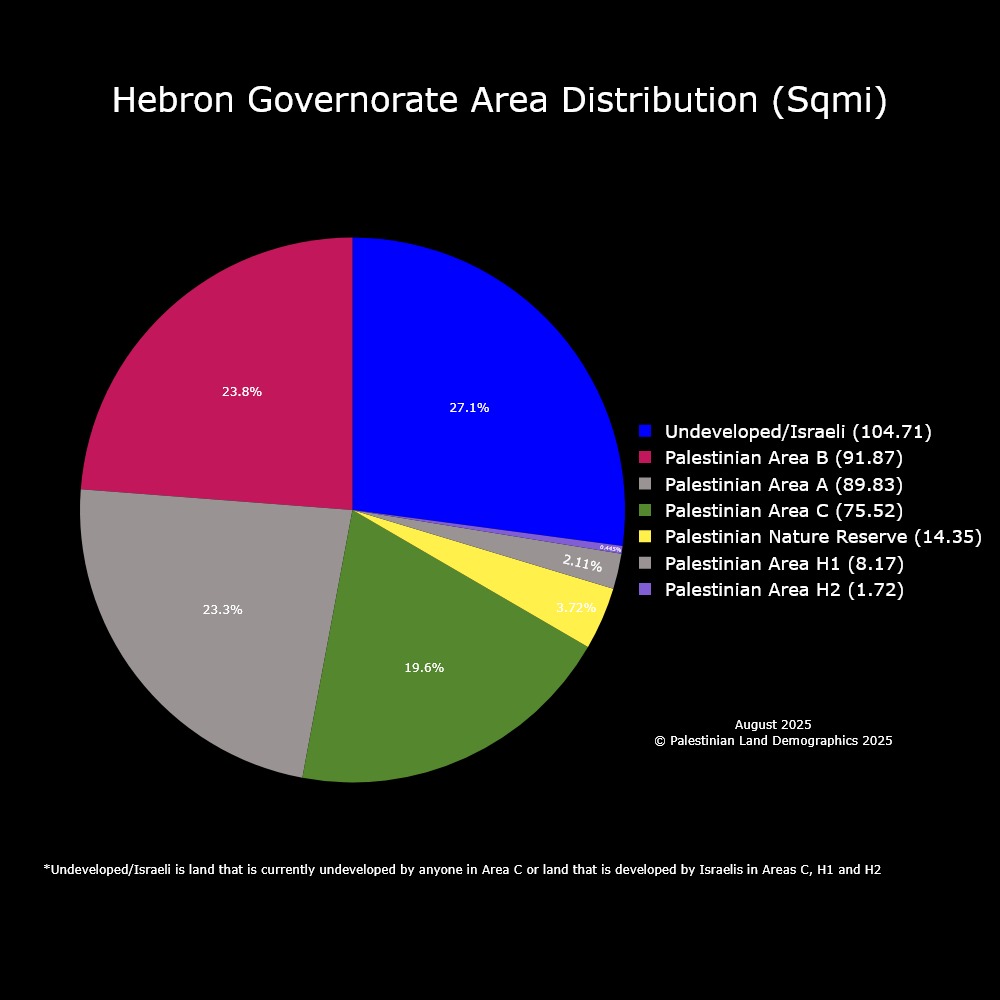
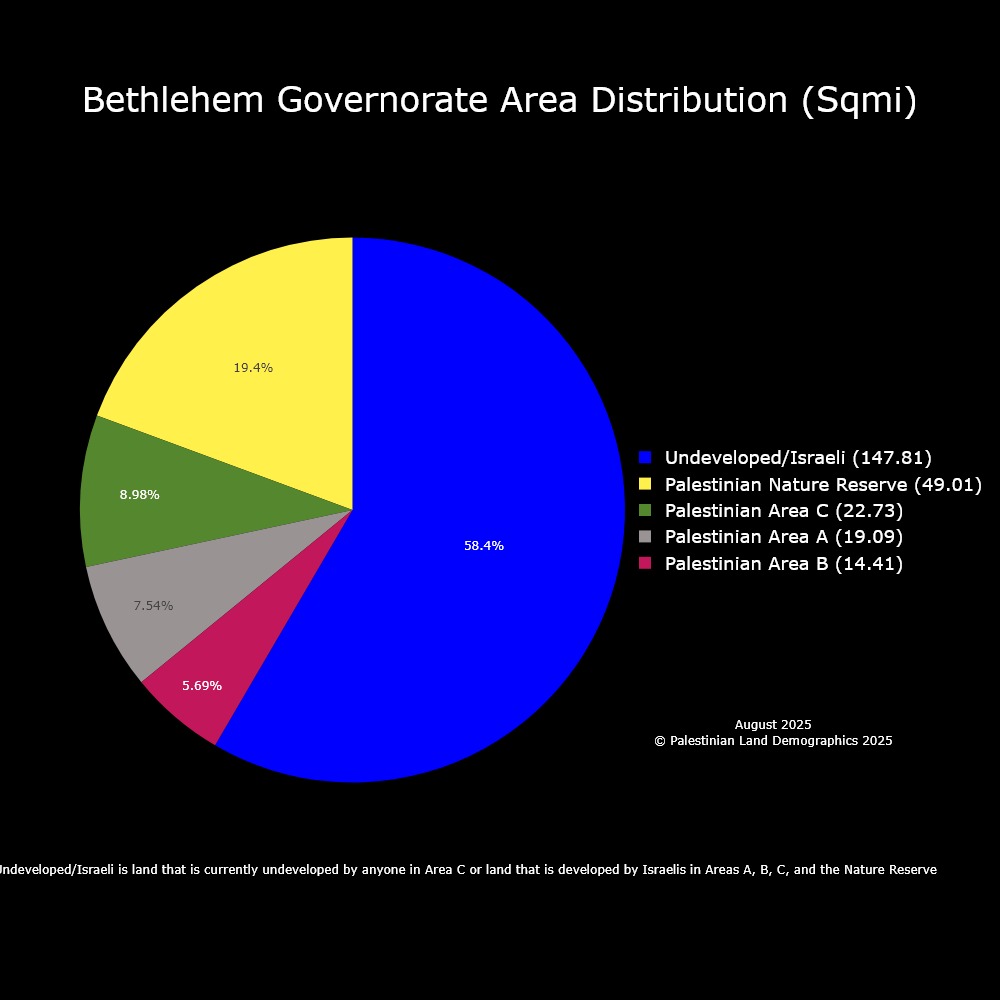
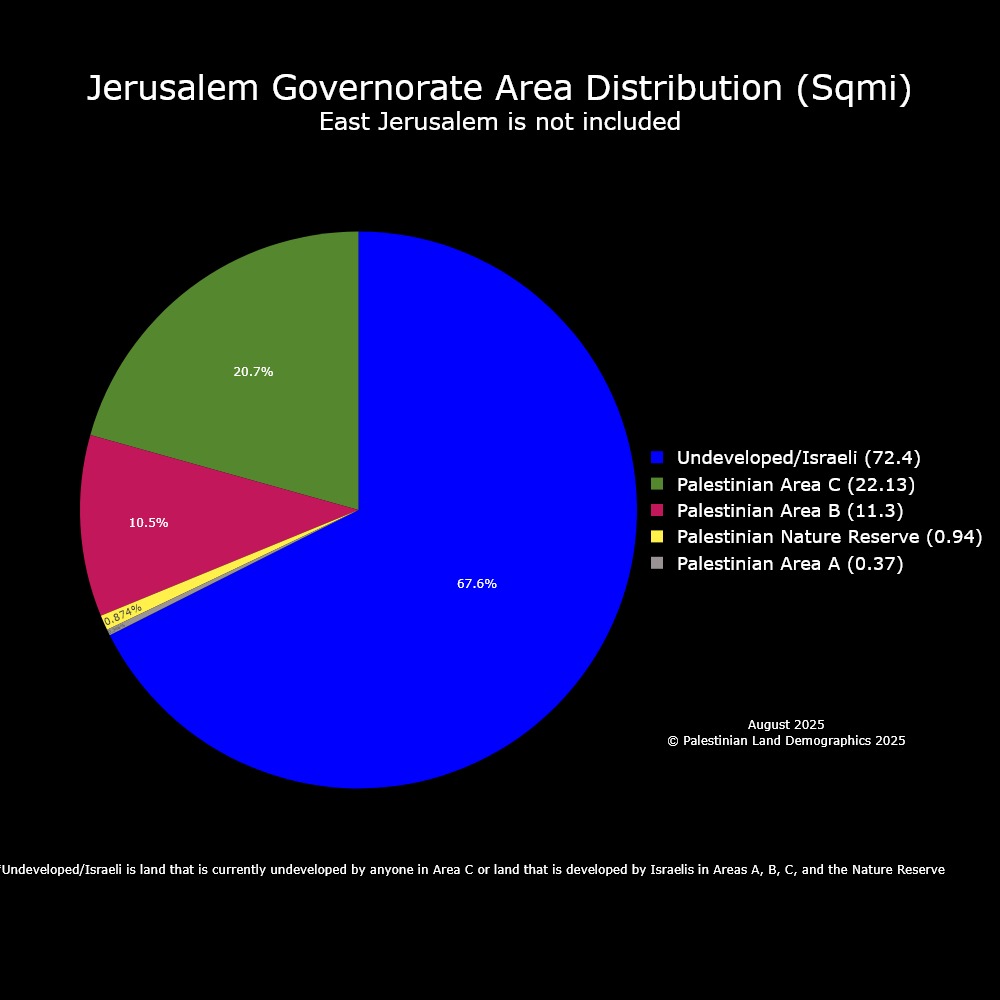
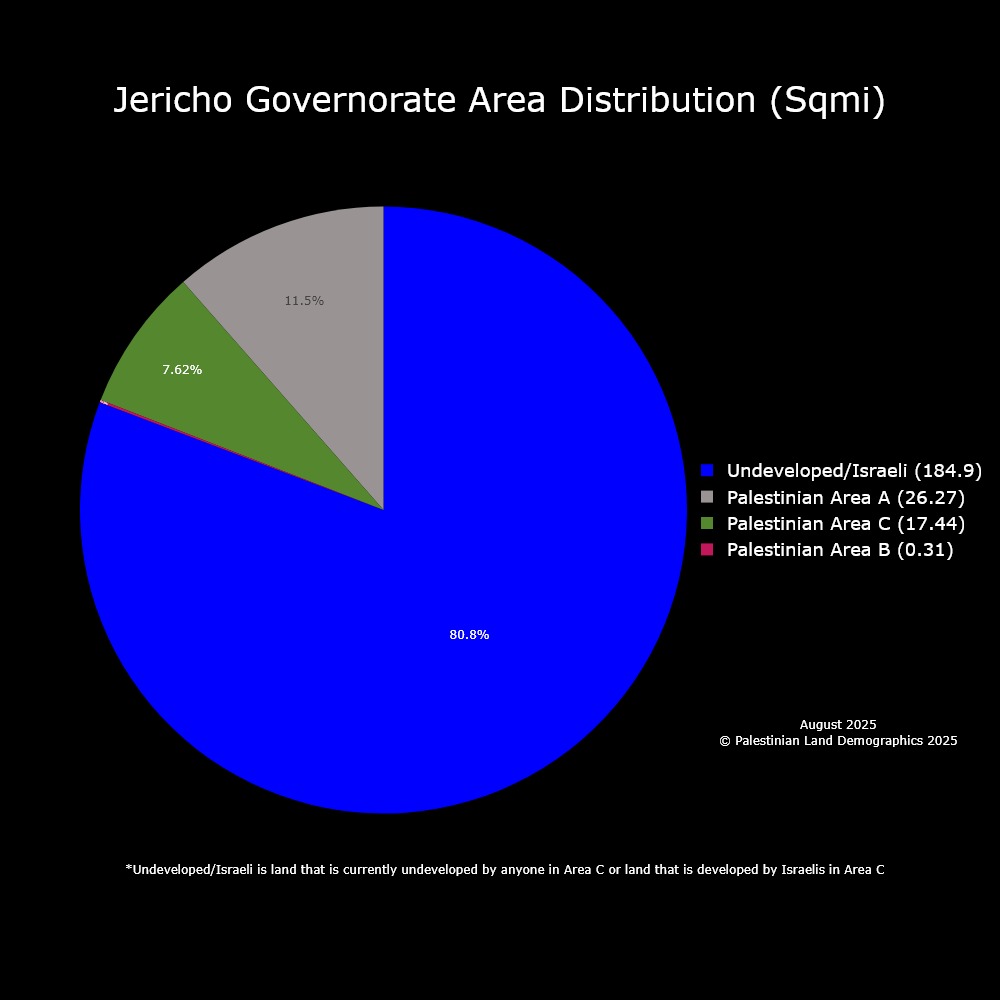
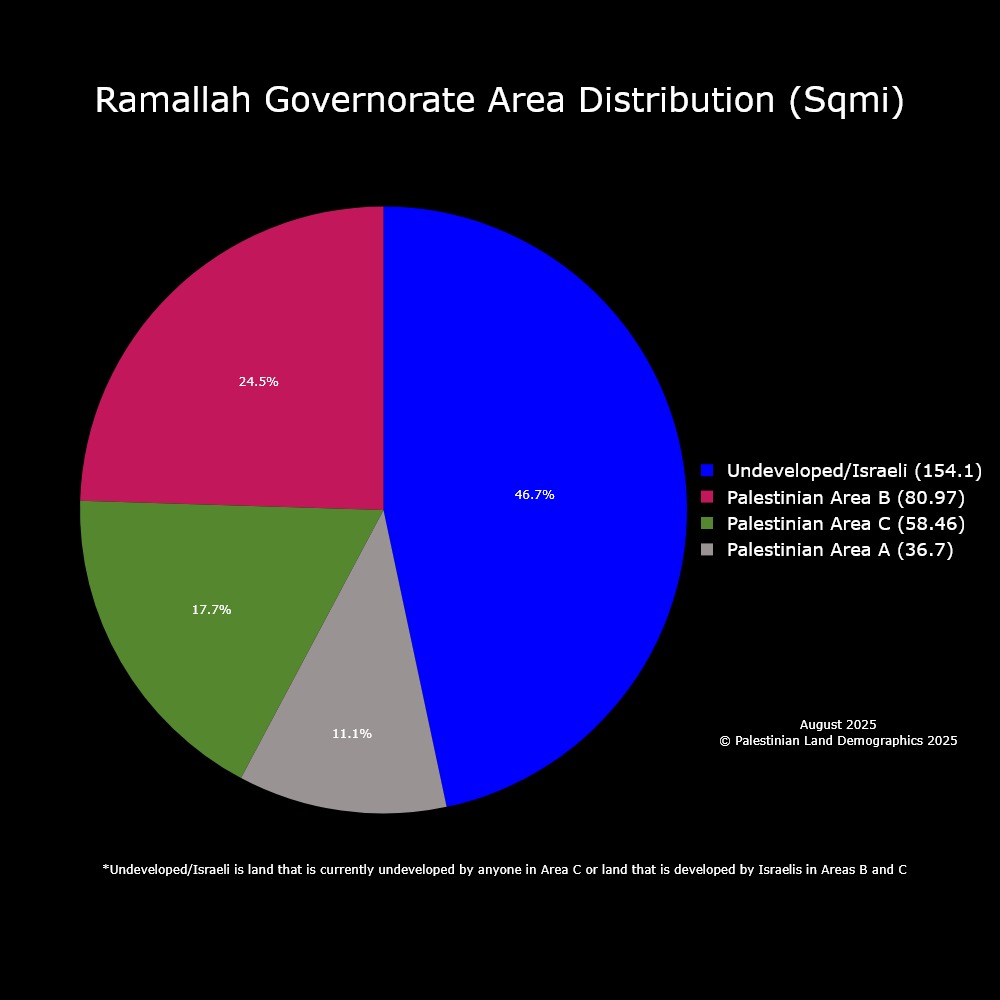
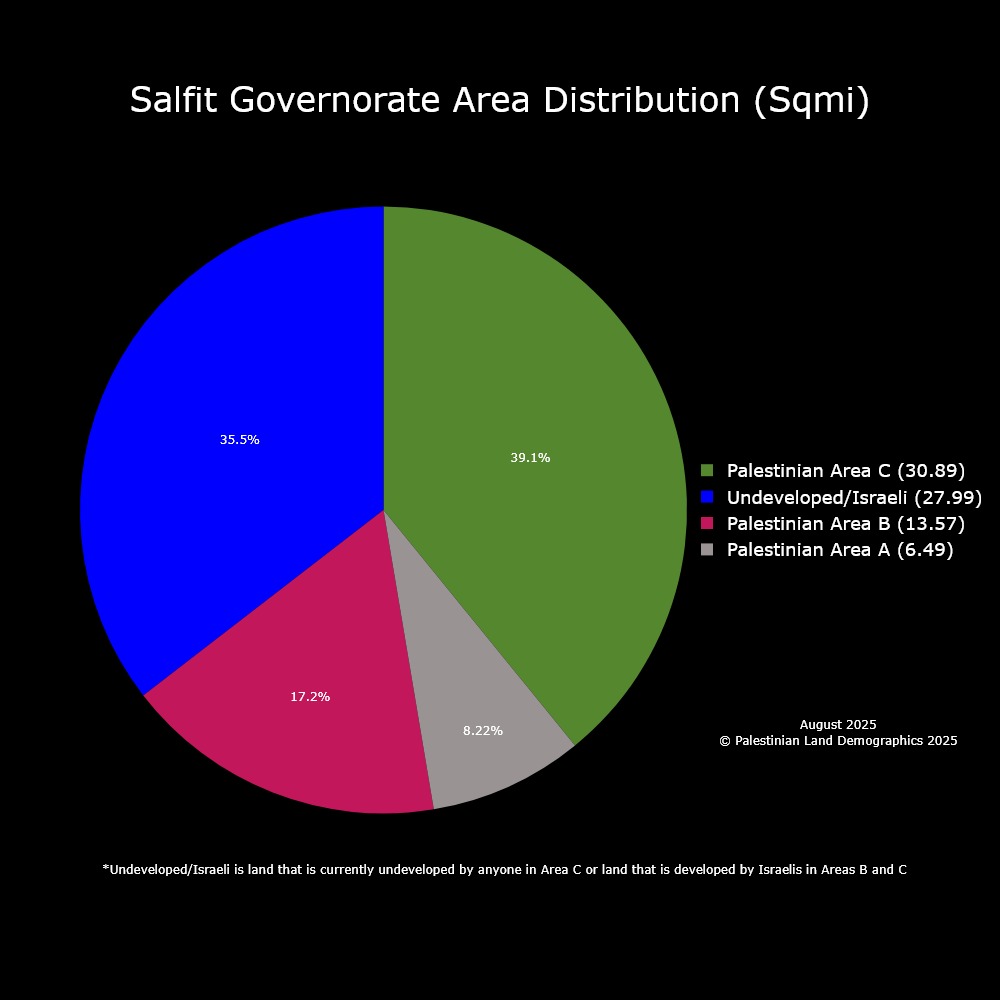
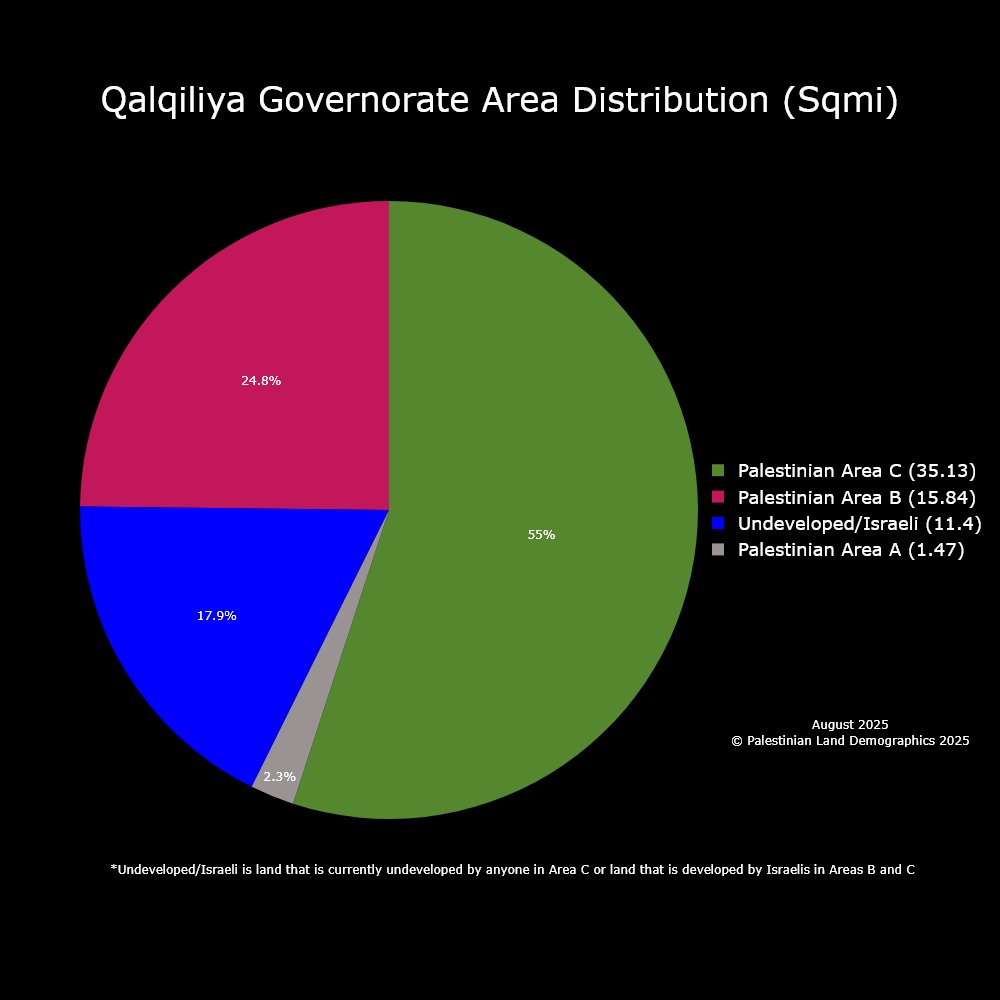
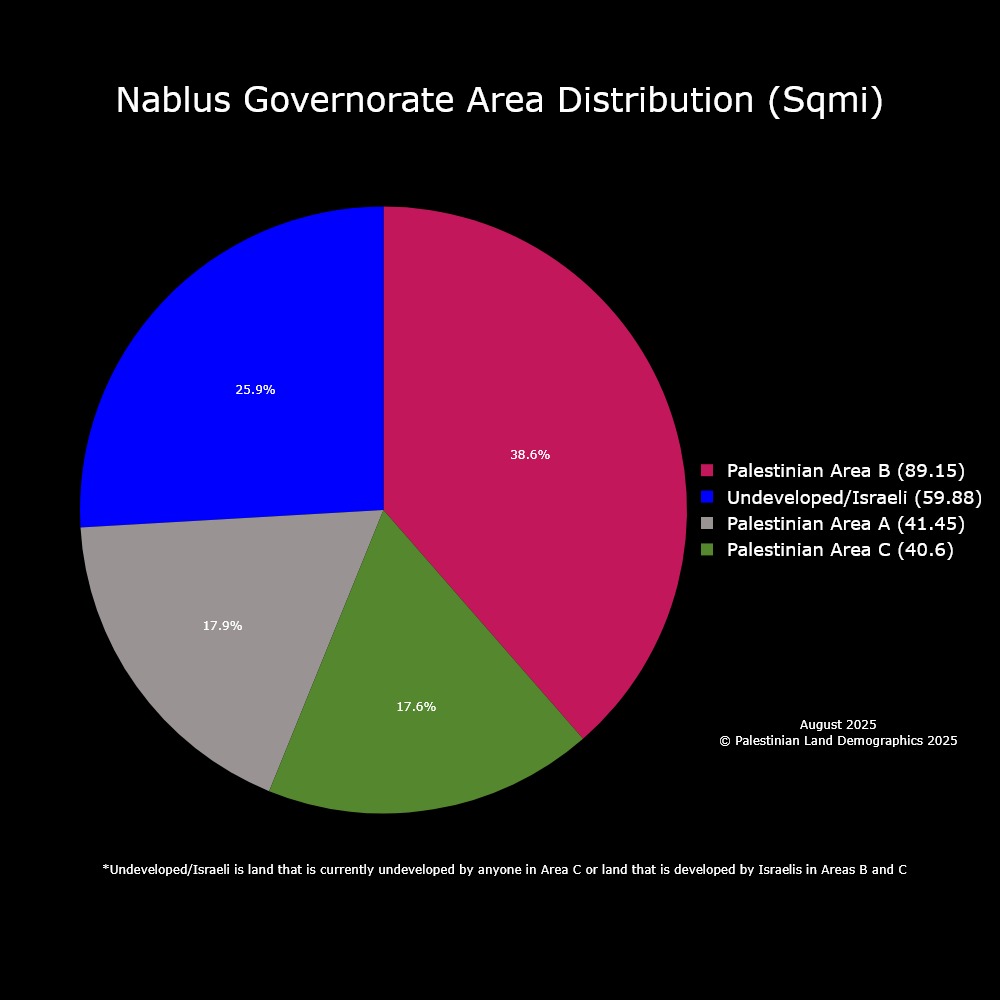
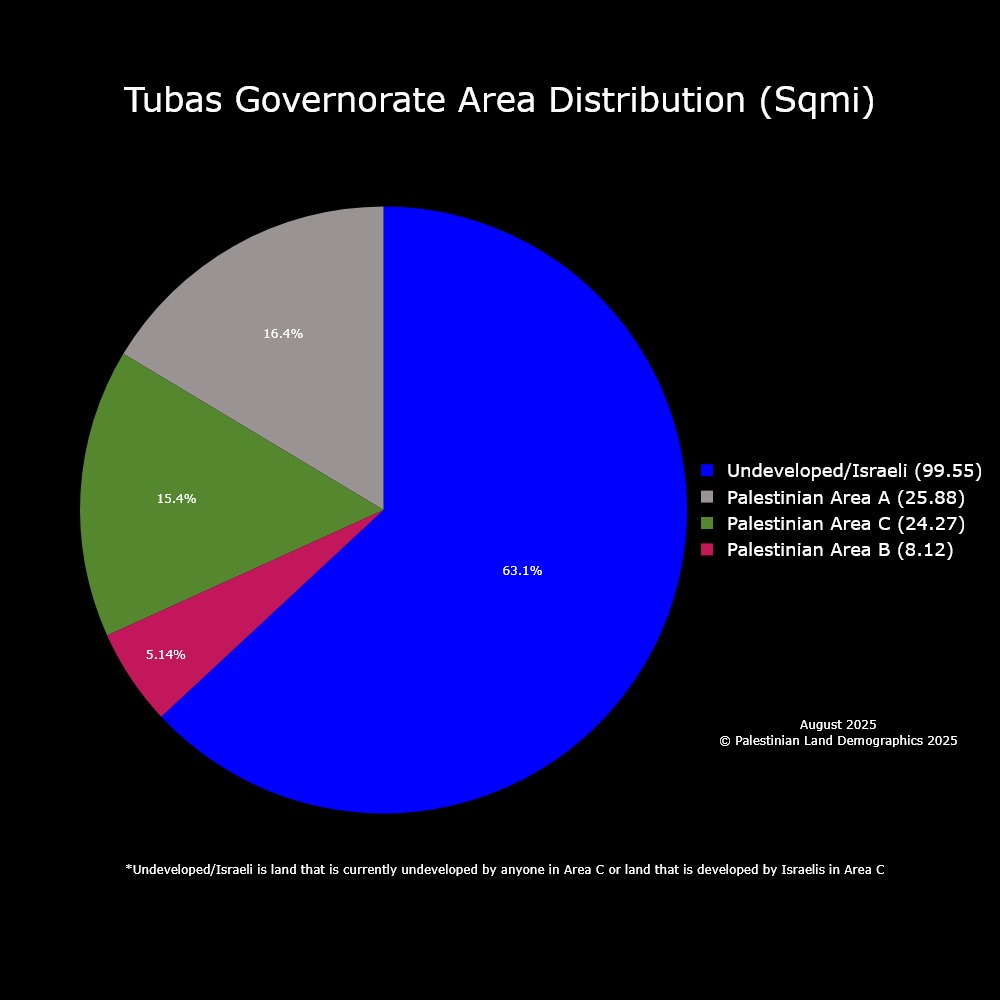
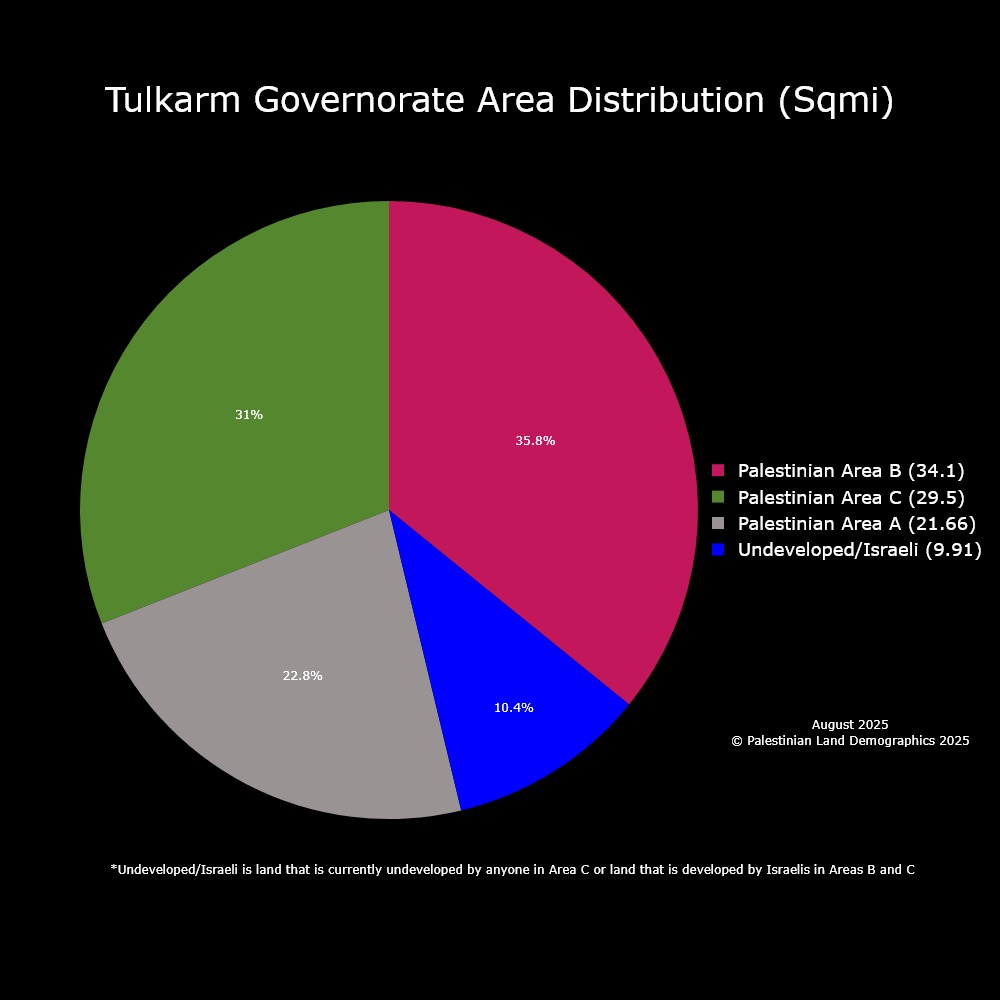
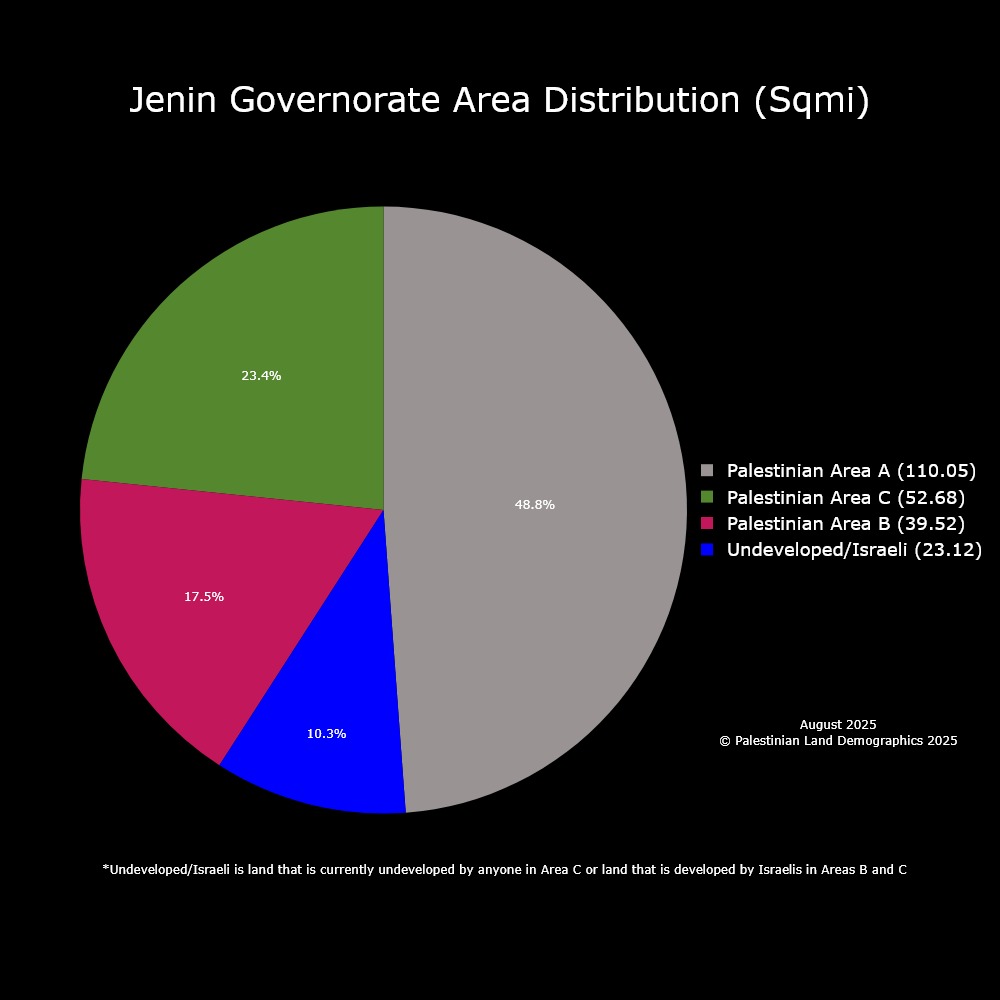
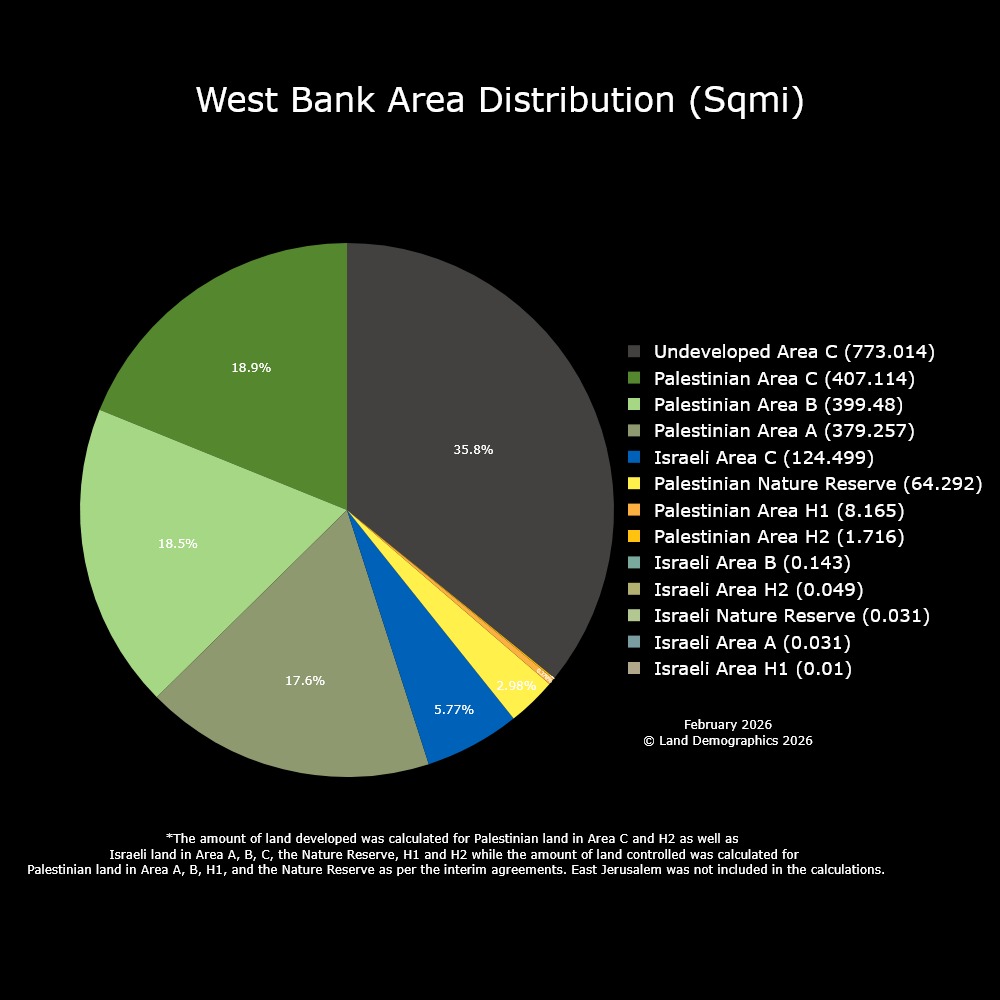
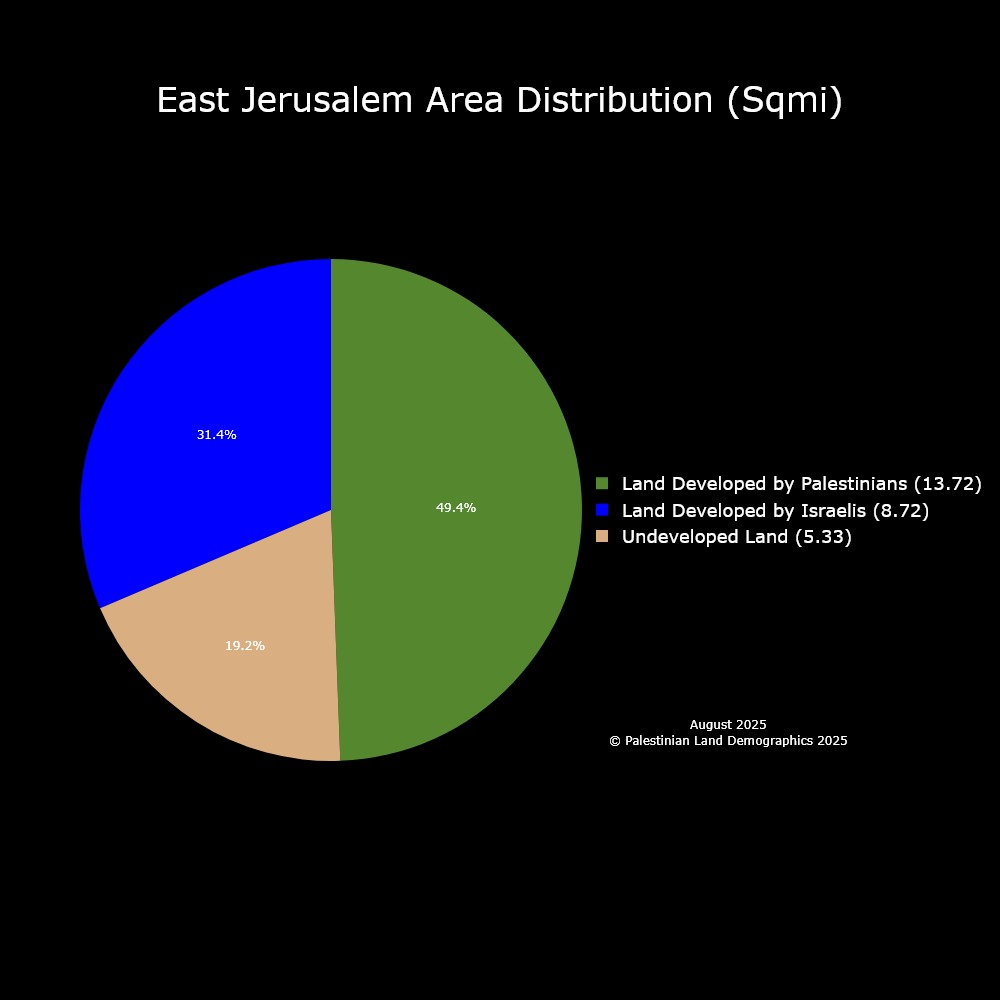
A representation in square miles and percentages of Palestinian and Israeli controlled/developed land
(Charts and Percentages are updated monthly)
Currently working on Israeli Developed Land in Israel Proper

Please let us know if you have any improvements or corrections that we can make.
